What do you need to start?
Basic questions all newcomers have.
Registering a Tradingview account
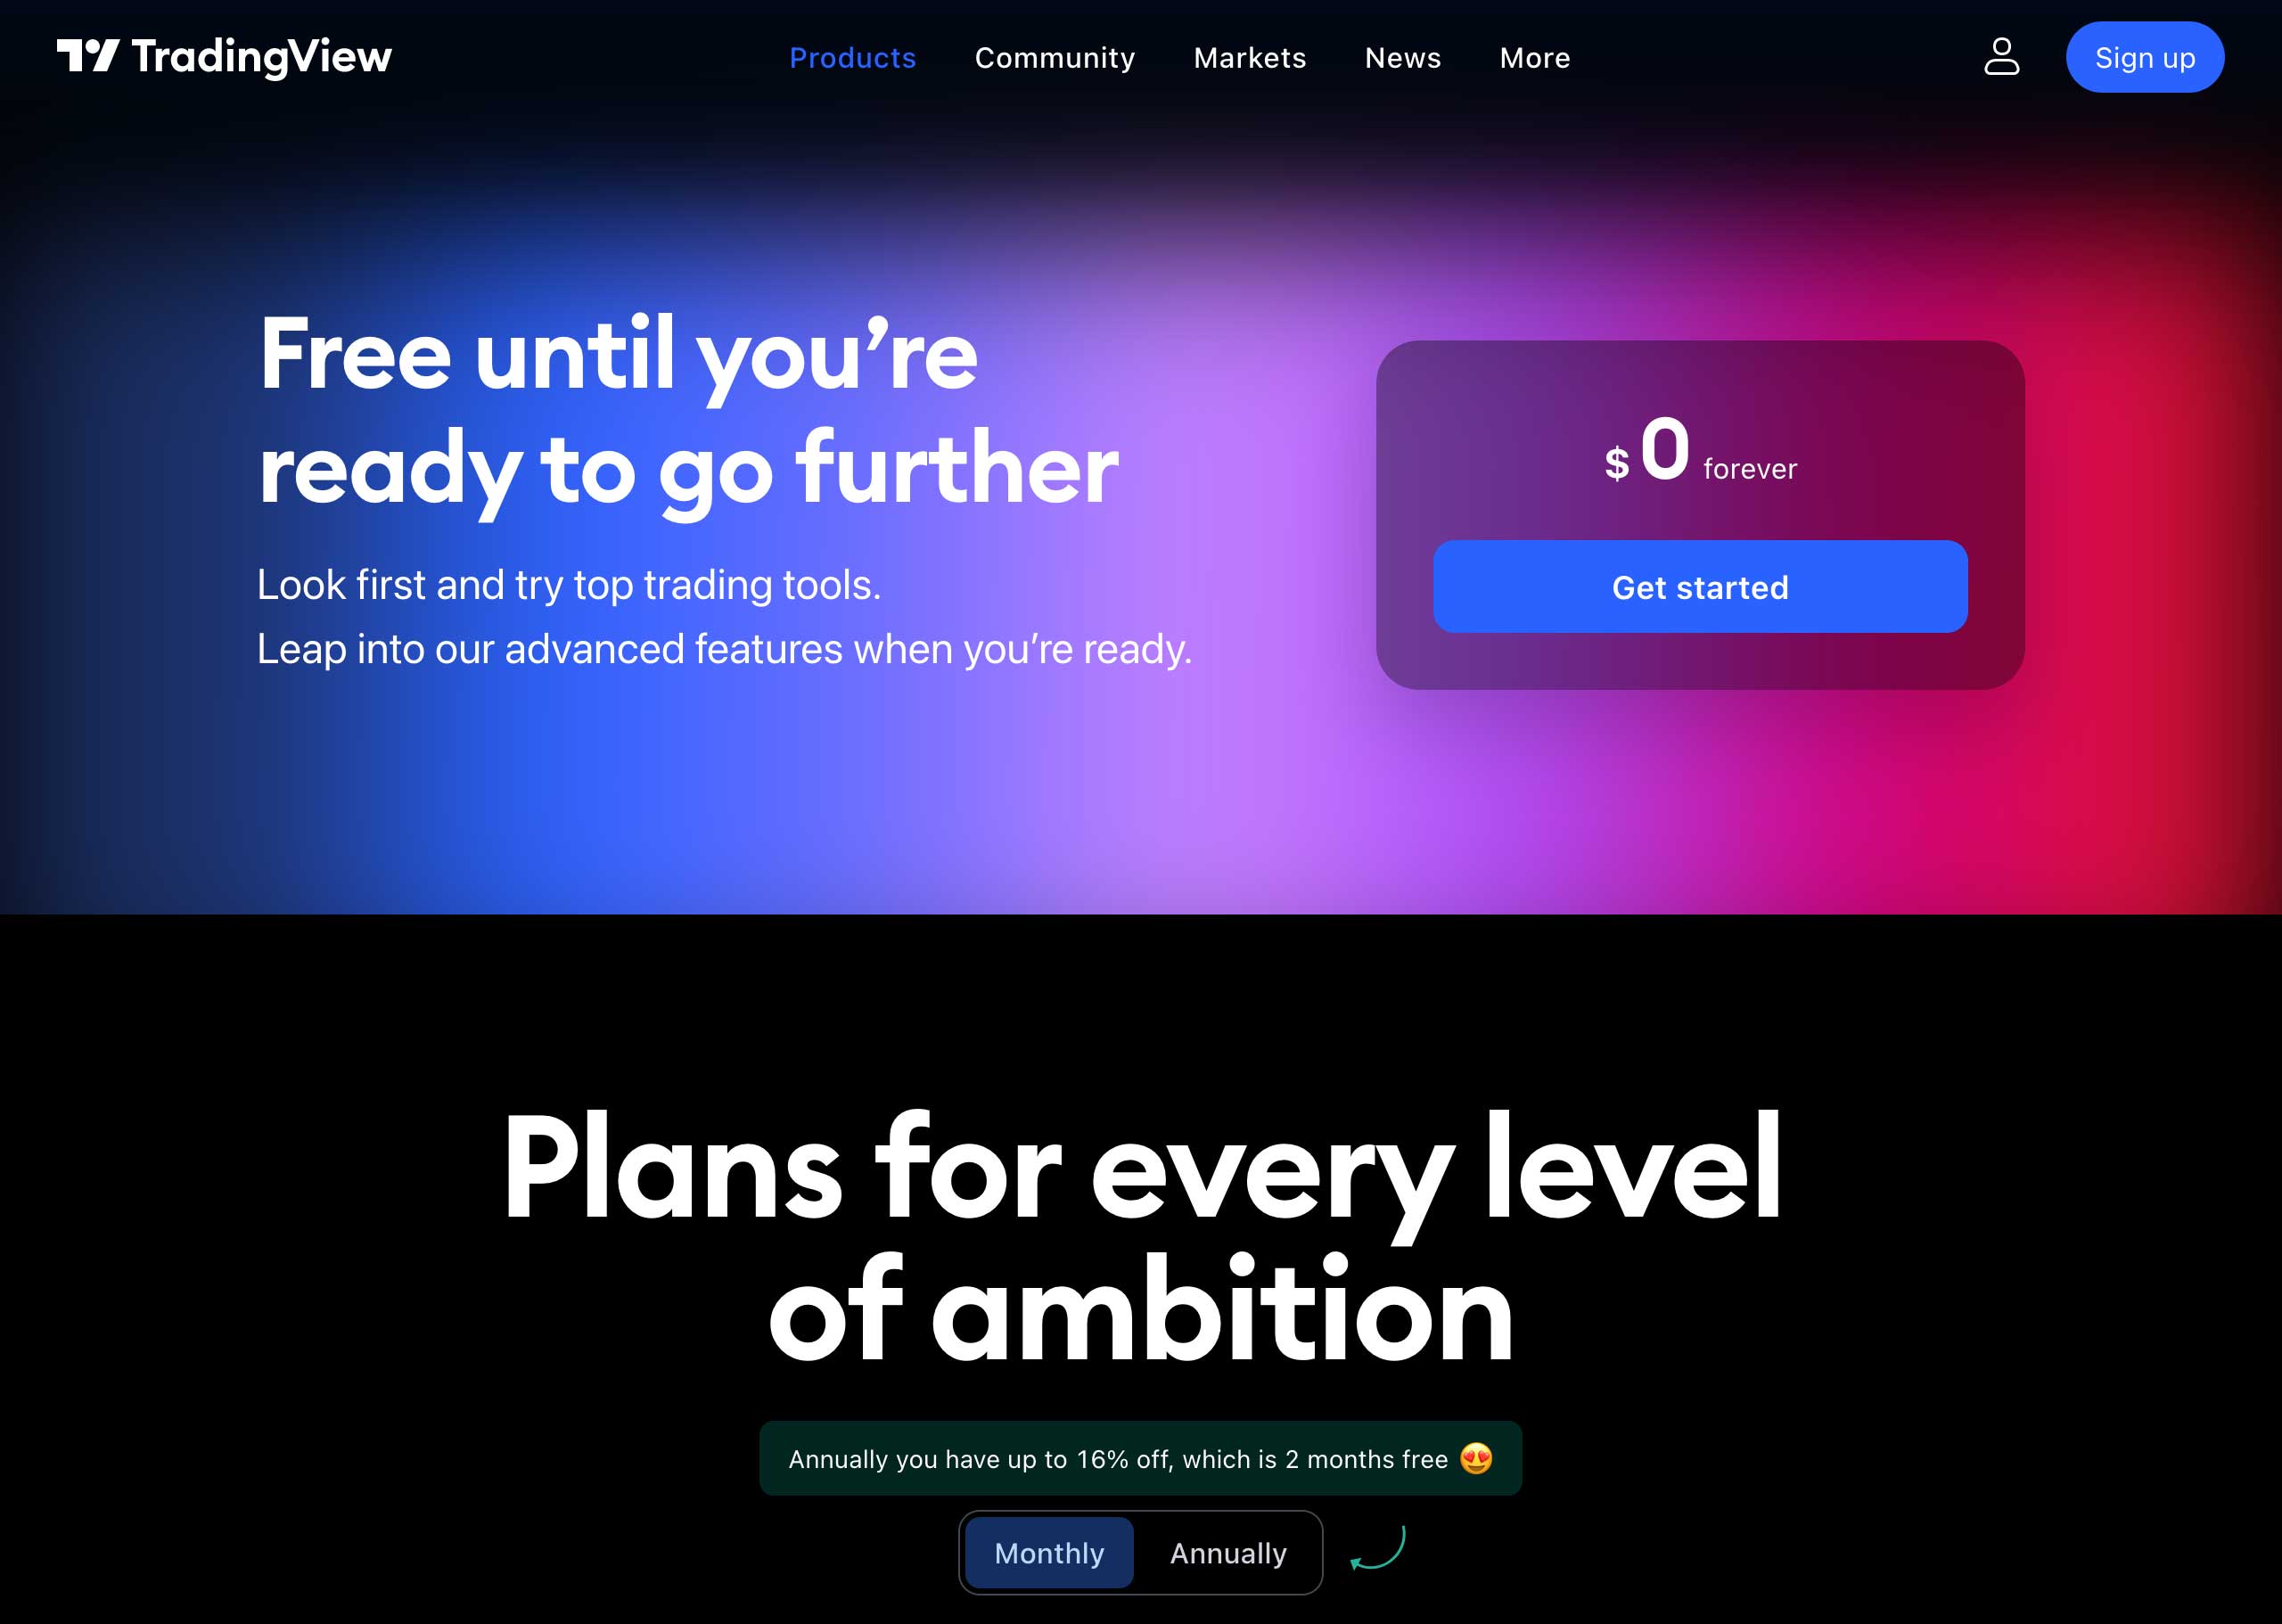
The first thing to do before starting work and buying an indicator is to register on the website www.tradingview.com if you don’t have an account yet. Using our link during registration, you will receive $ 30 to your account if you continue to purchase a paid subscription.
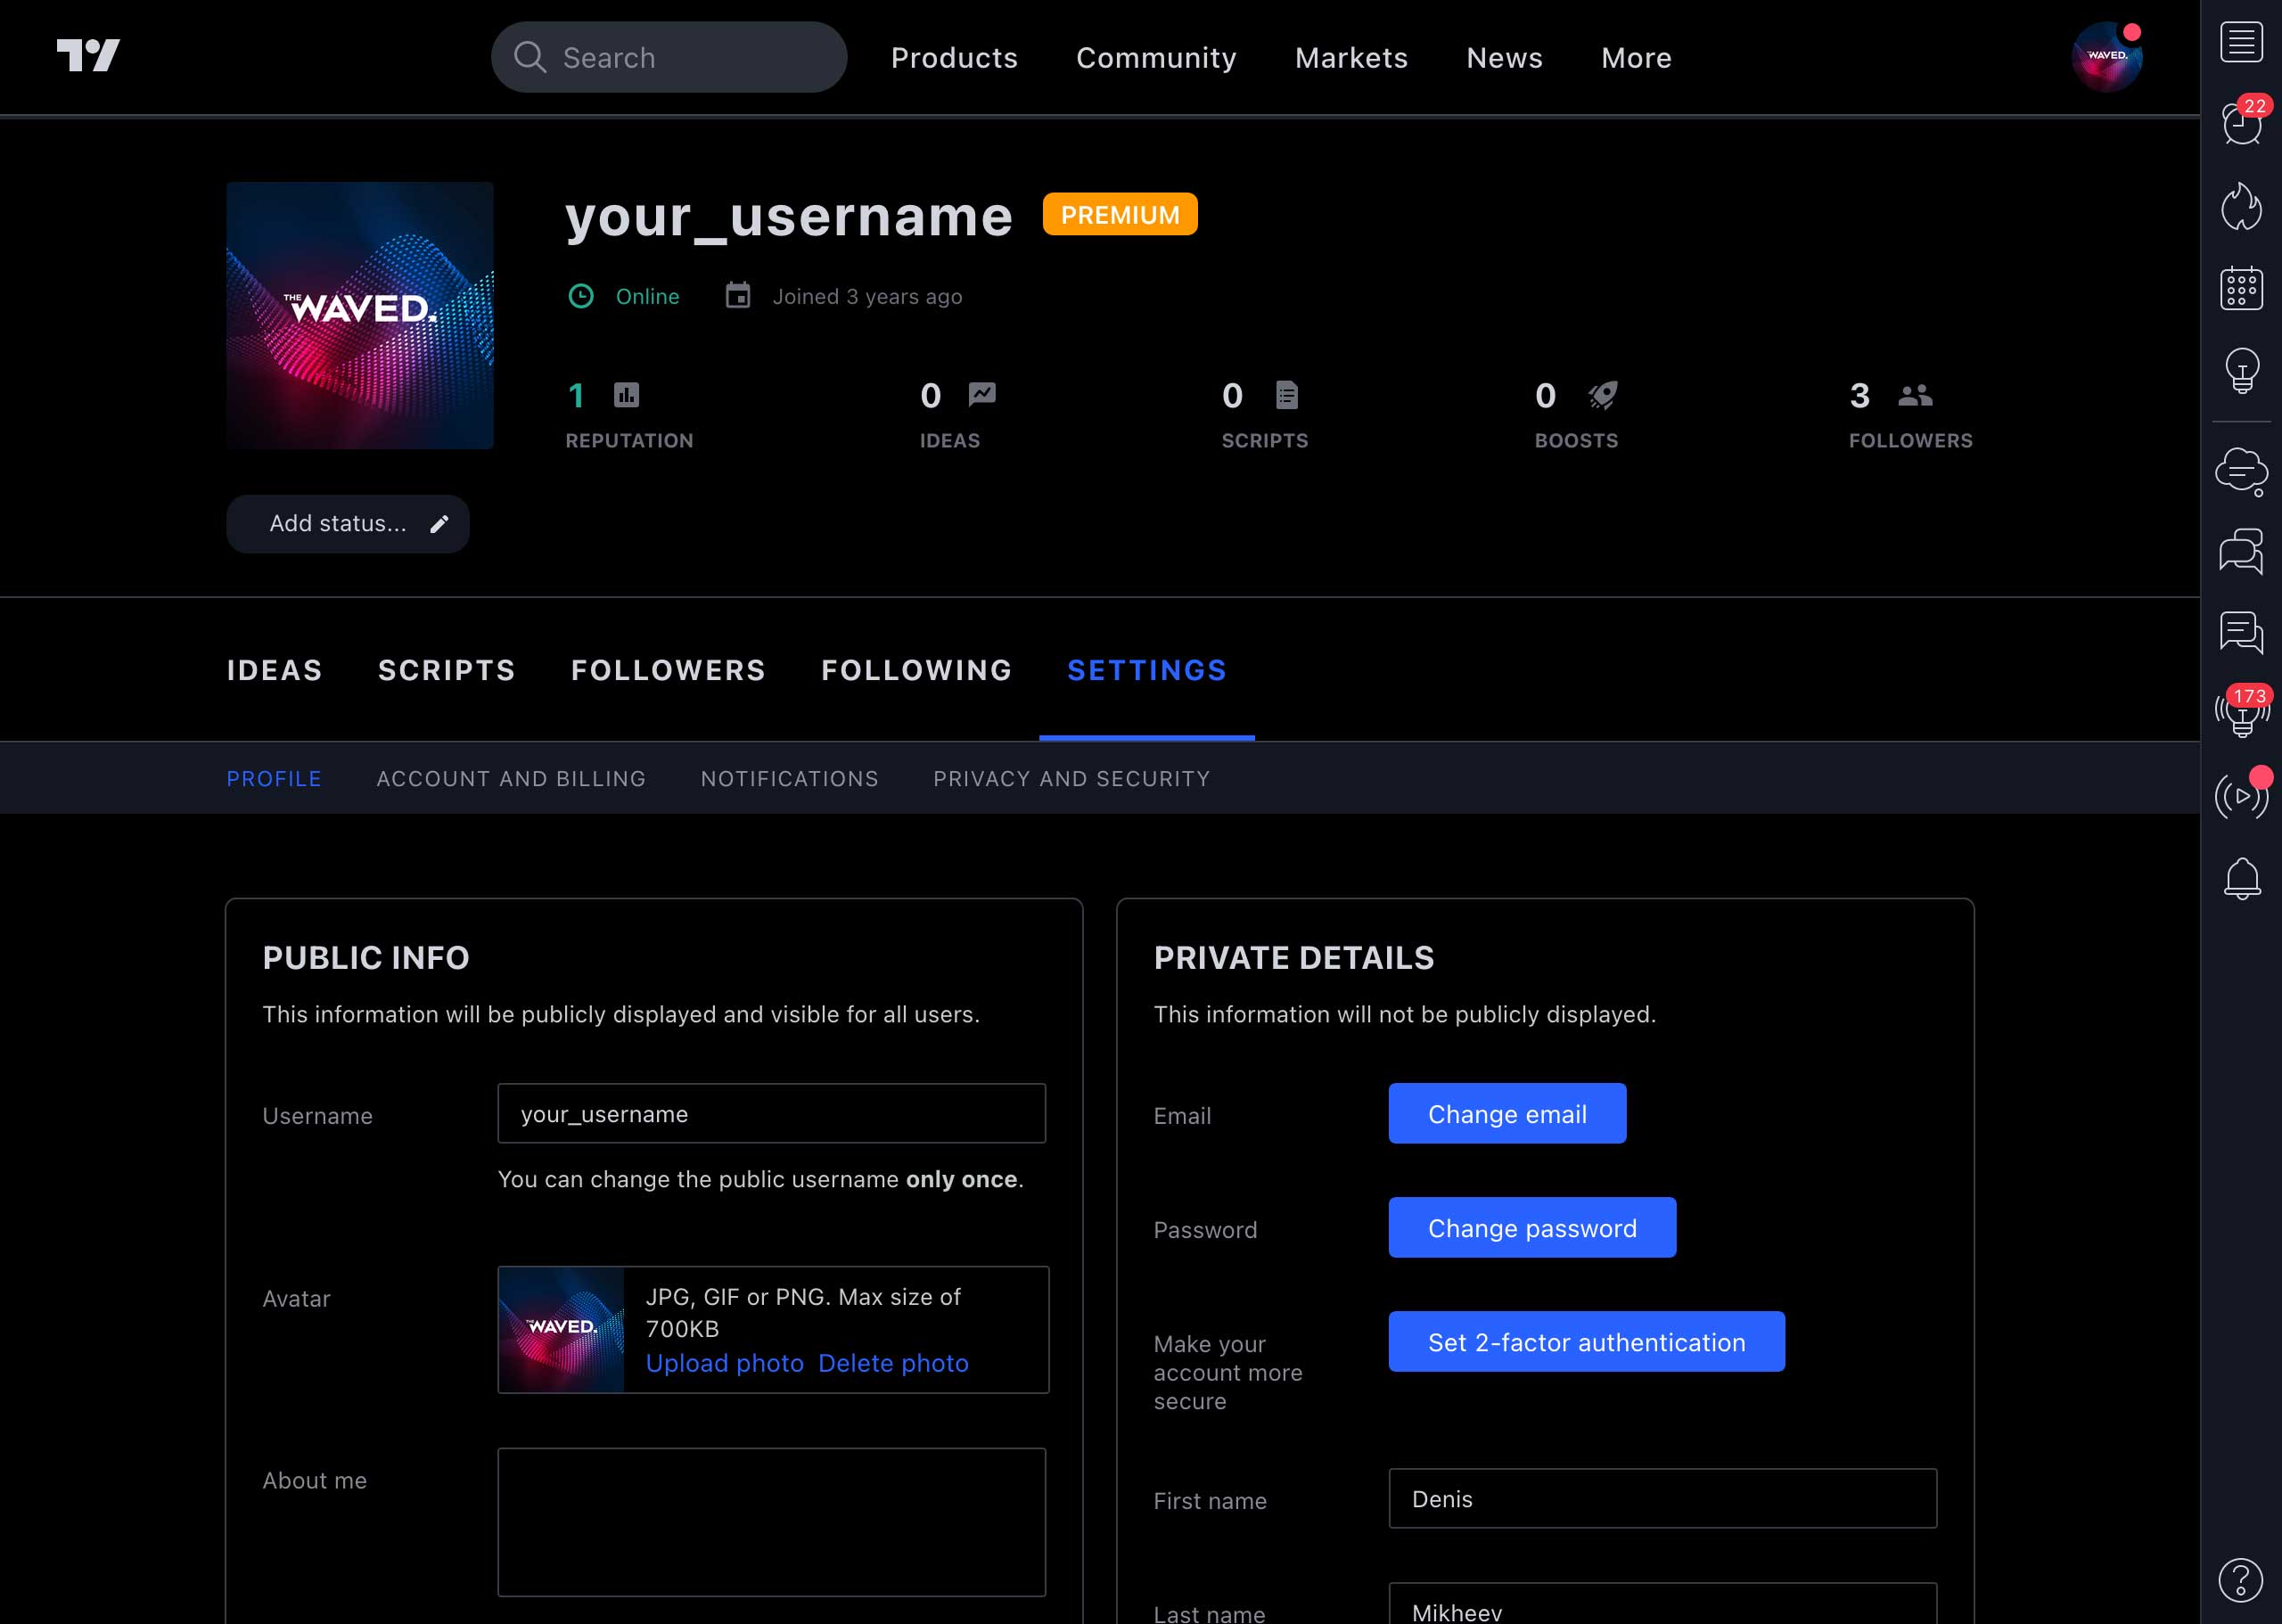
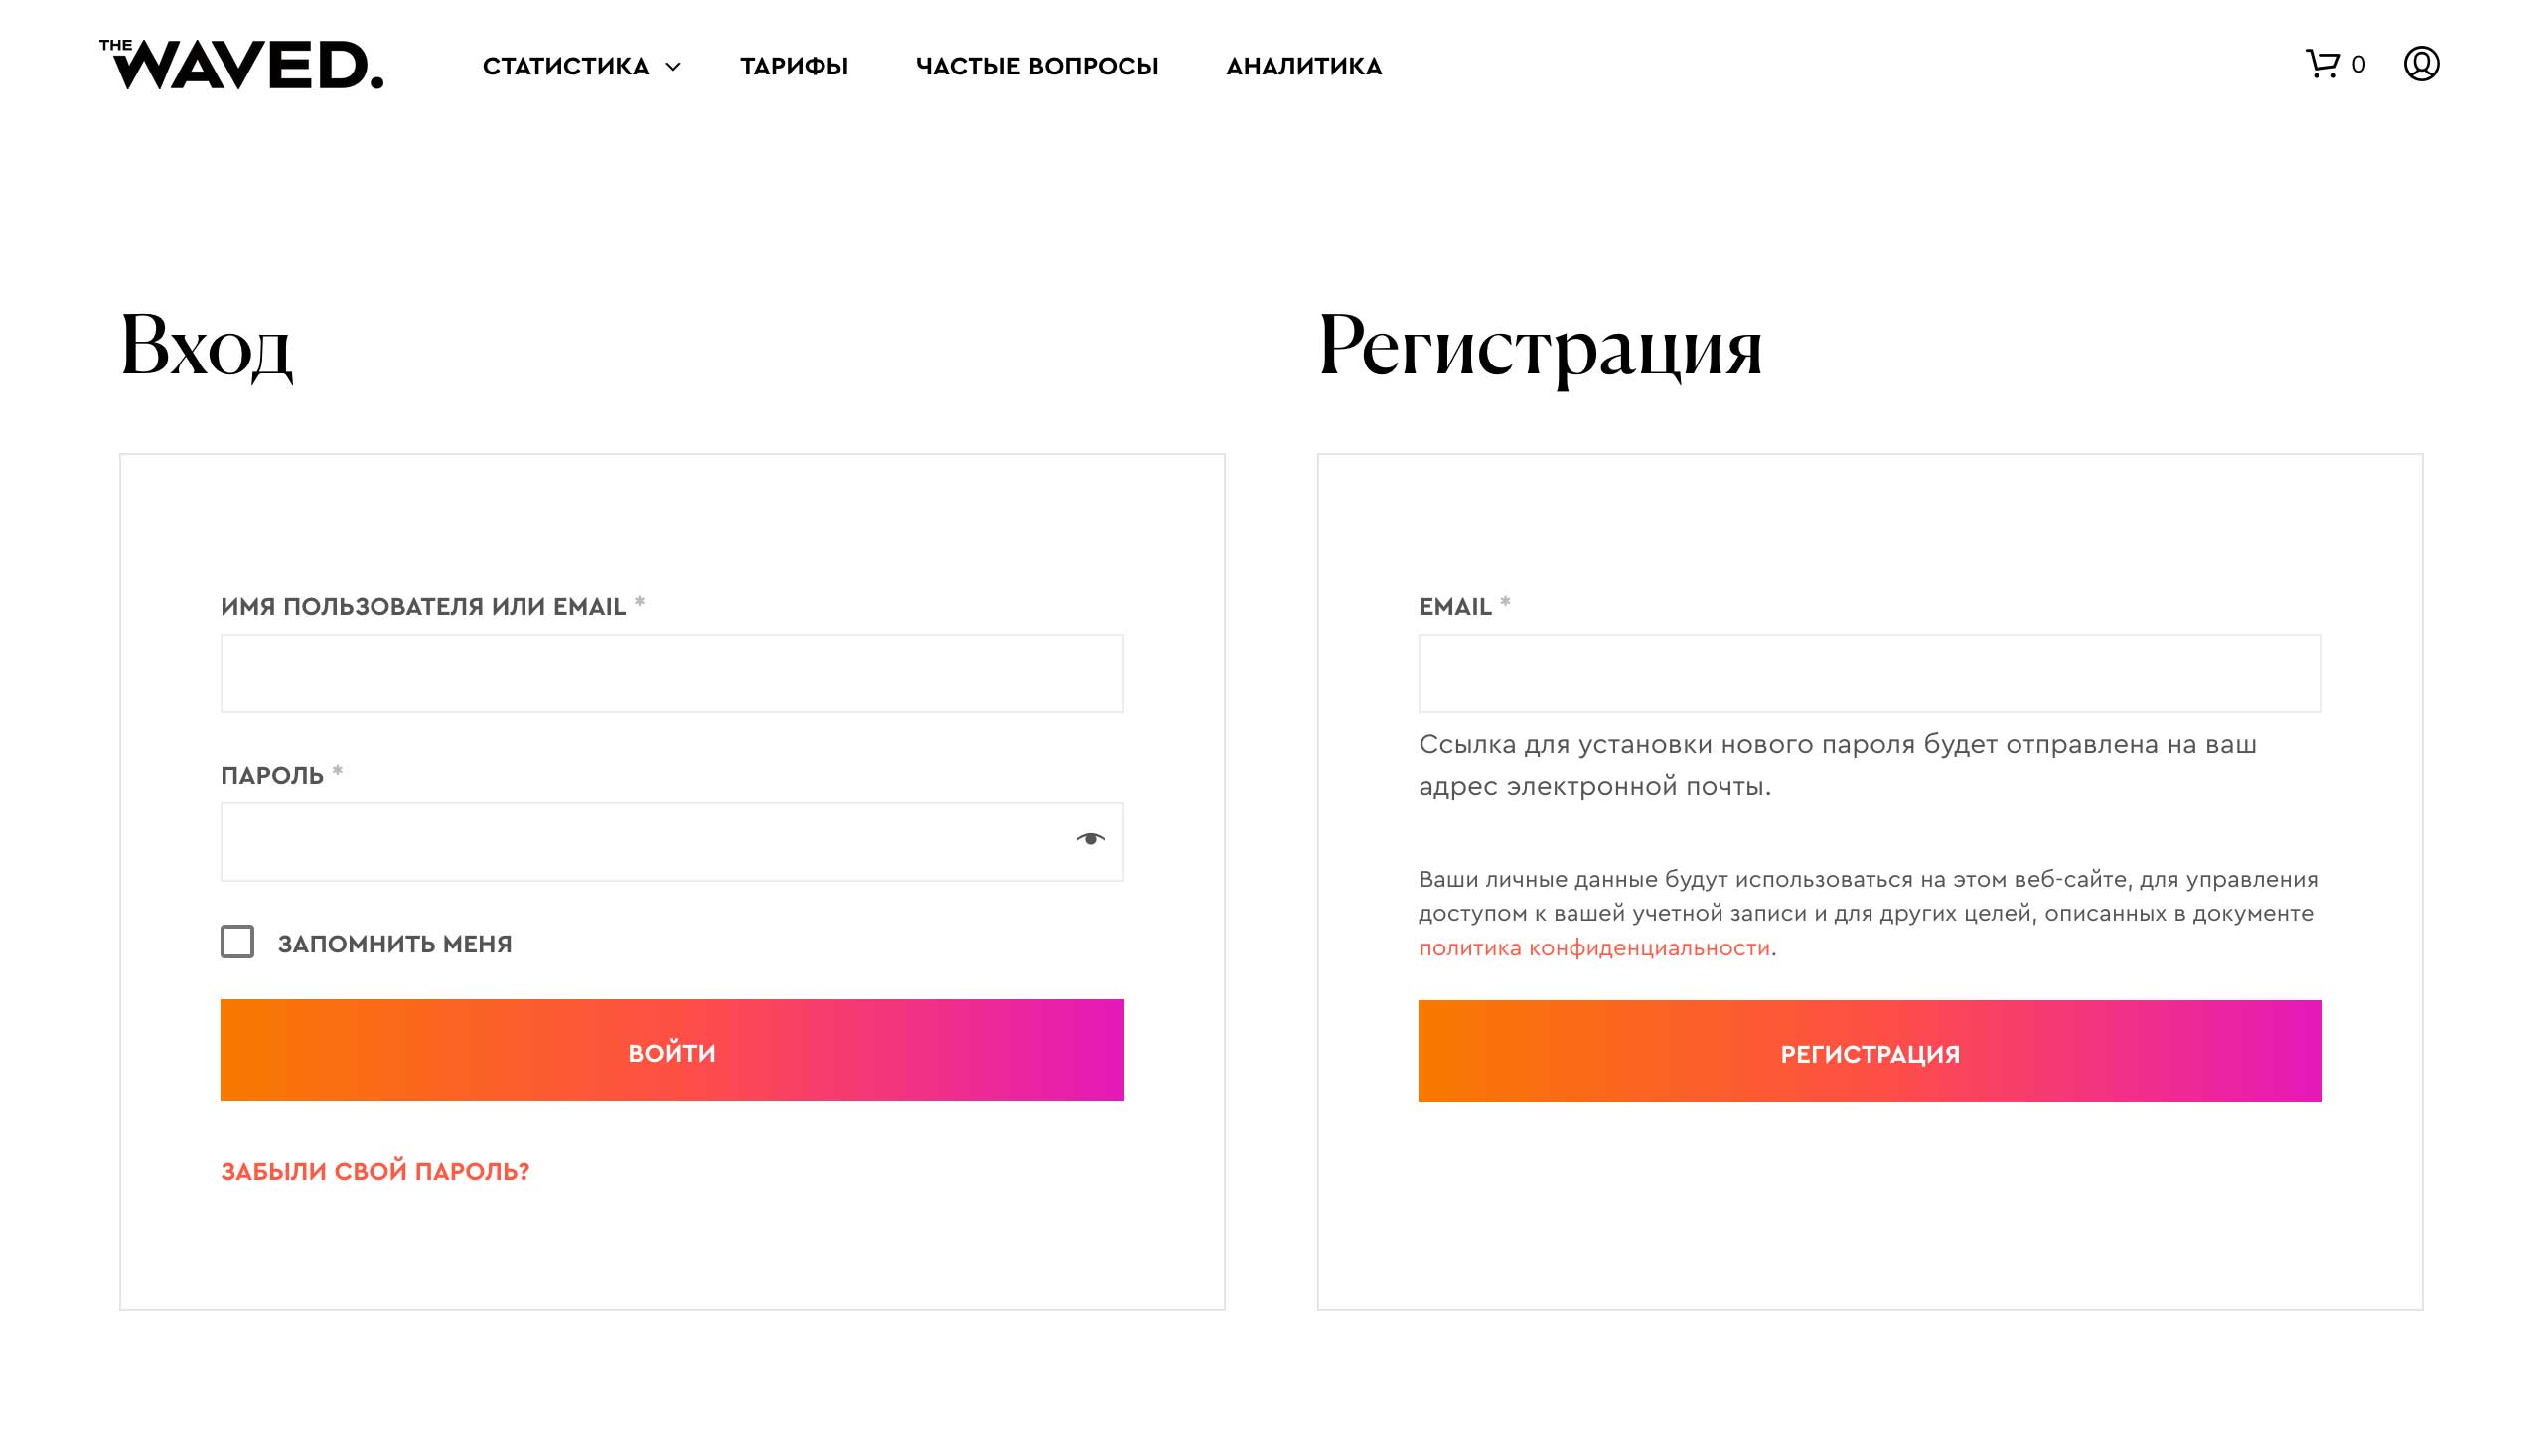
After following the link, you will see a registration window where you will need to enter your email and create a nickname and a password. Use only public mail such as gmail, yandex, mail, etc. since Tradingview does not register accounts with domain names of private companies. For example, if you have a work email with the domain name of your company, it is not suitable for registration. Then you will receive an email to confirm your registration. Open it and follow the link. After that, you can set up your account. Select a photo for your avatar, since Tradingview is also a social network and here you can communicate with other users. Next, you can configure two-factor authentication and other parameters.
To work successfully, you need to buy a subscription to Tradingview. The site has three different subscription options to fit the needs of any user: Pro, Pro+ and Premium. Among other things, they differ also in the number of alerts that you can configure based on the signals of our indicator. There are only 20 of them in the Pro subscription, 100 in Pro+, and up to 400 alerts can be configured in Premium.
We recommend that you take the trial version for a Premium subscription and experiment with the number of signals you want to receive. In this way you can decide which subscription option is right for you. After 30 days, you will be able to change your subscription if necessary. Just don’t forget to disable the option of automatic charging your card after you subscribe, if you just want to test the highest version first. Then you can enable it again when you buy a paid subscription in a month.
Account registration on the crypto exchange
To put into practice the received signals, you need to register on the crypto exchange. We offer you instructions on how to register on the most common exchanges.
Binance Account
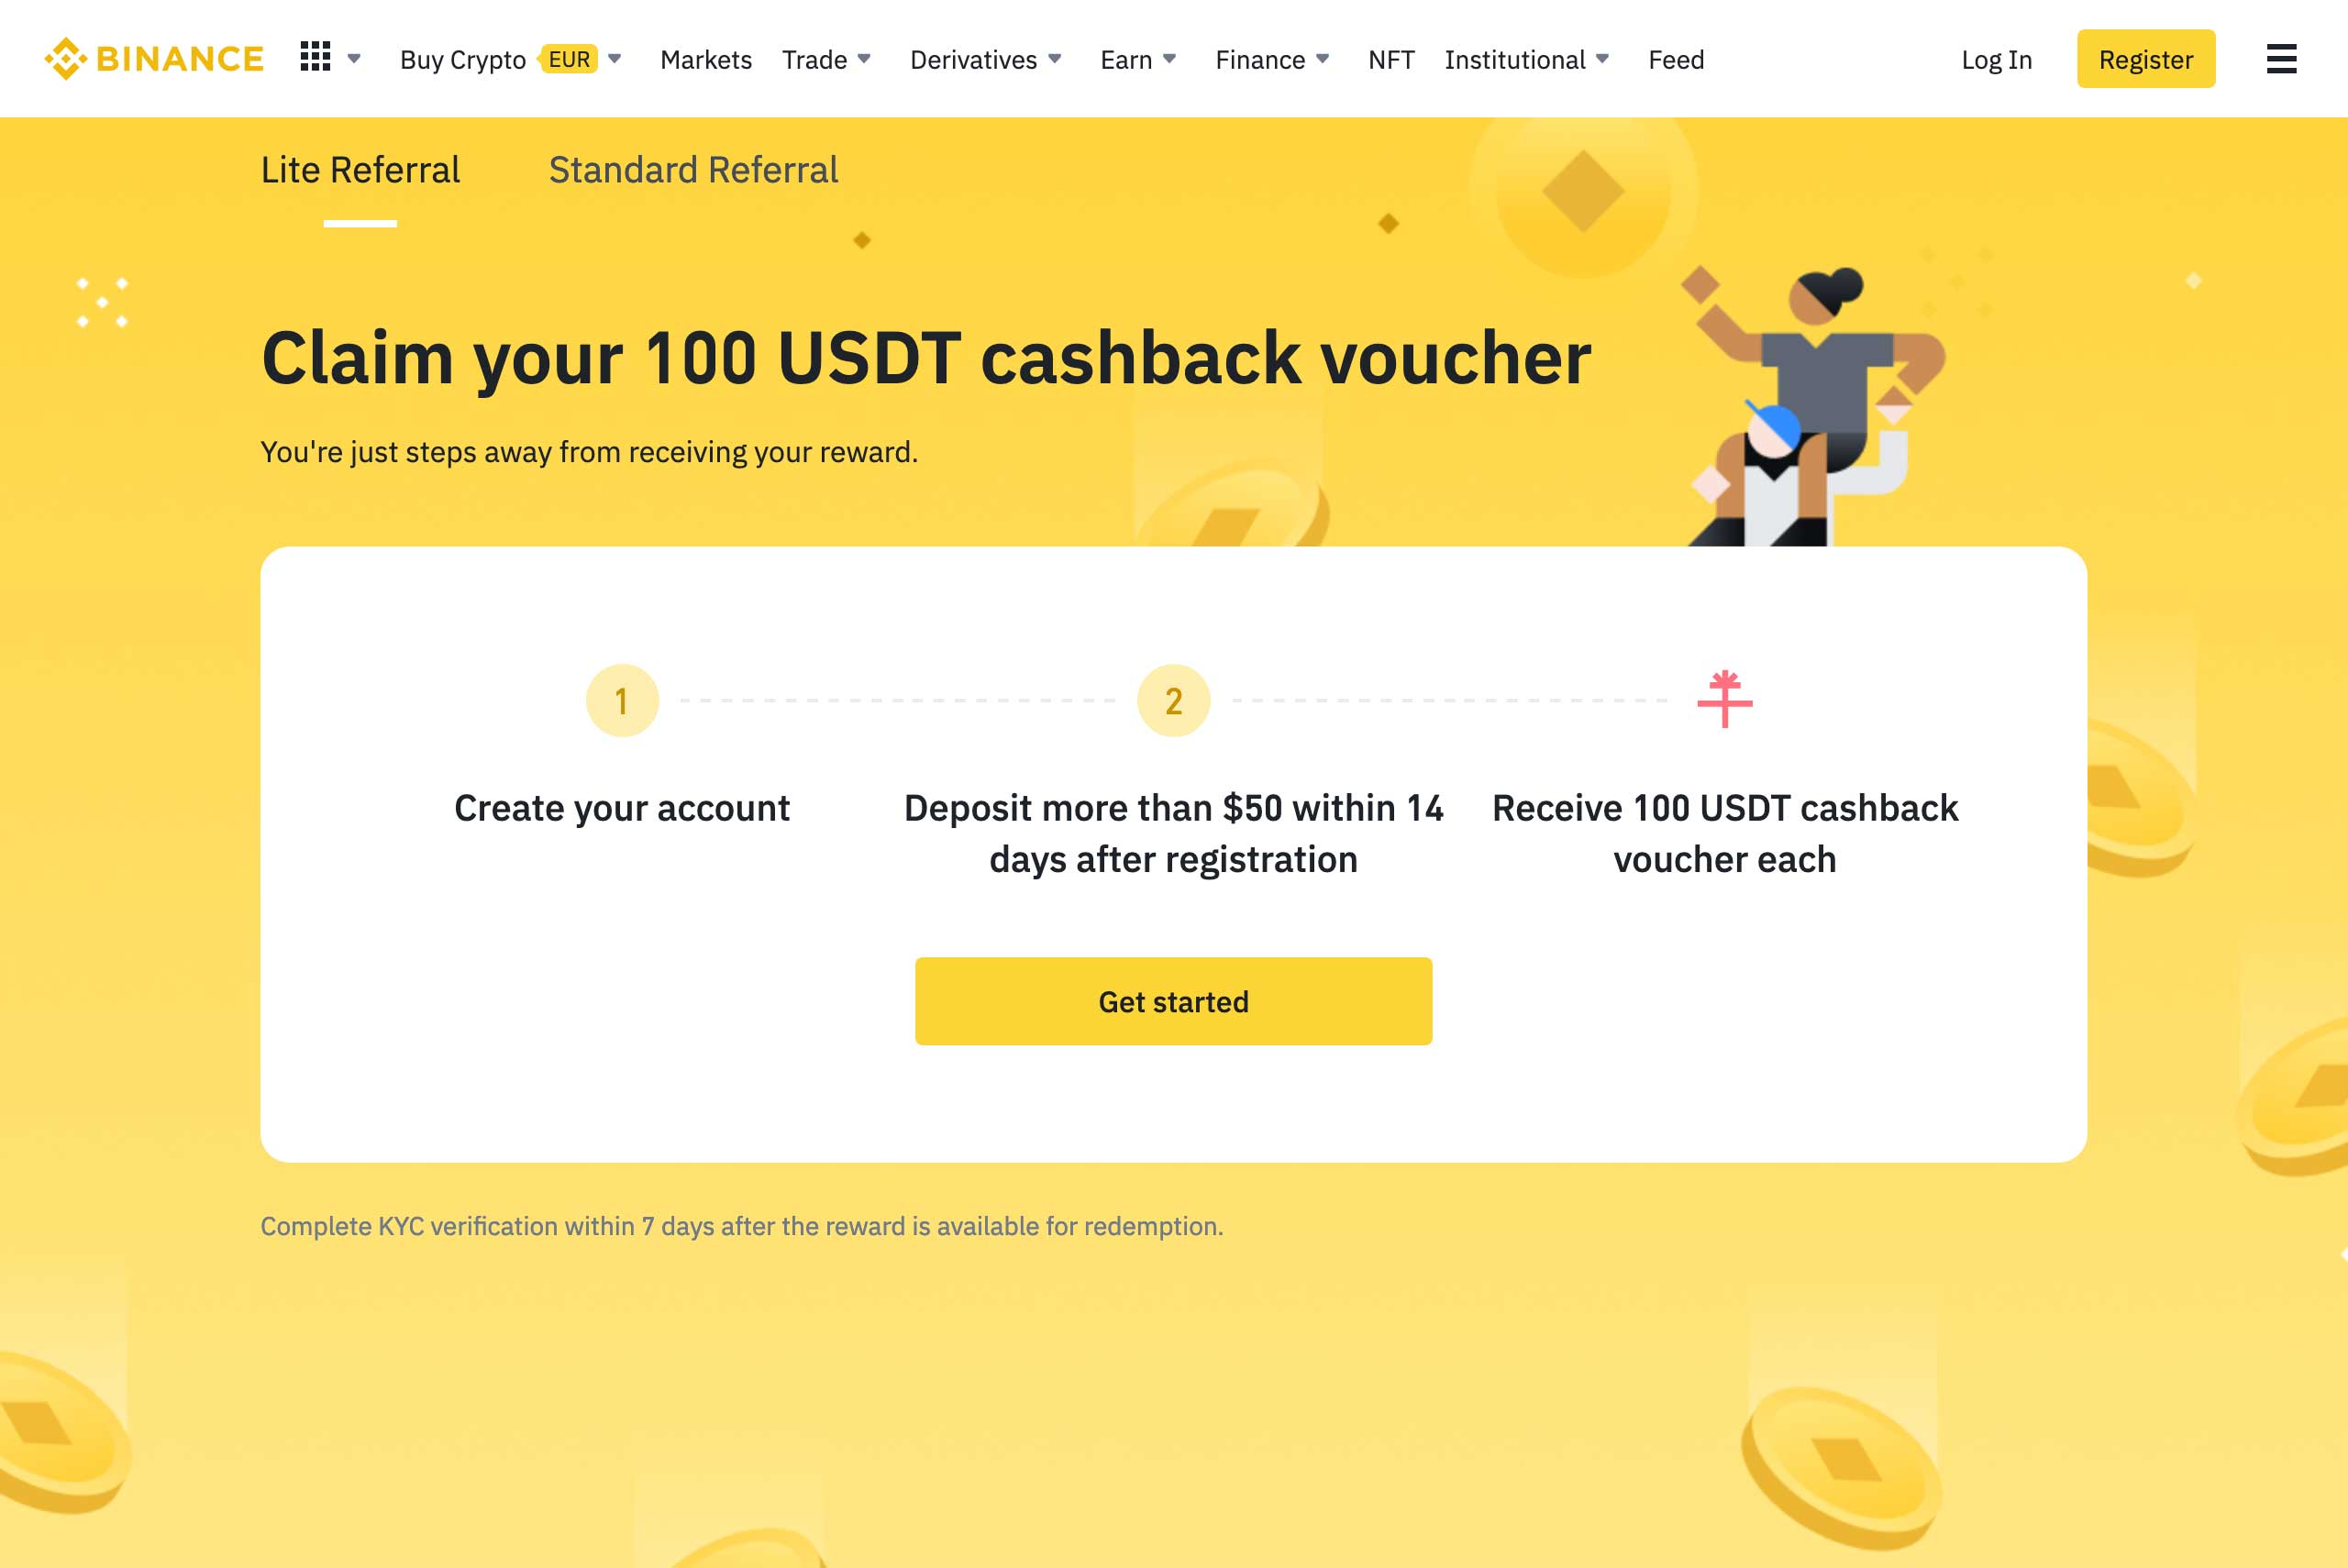
To register on www.binance.com, you need to go to the exchange’s website www.binance.com. You can do this by following our link, in which case you will receive a $100 bonus for your account. Currently, your balance on the stock exchange in Russia can be replenished either through direct cryptocurrency transfers or through P2P. To use P2P, you will need to pass authorization using a passport.
Subscribing to the indicator
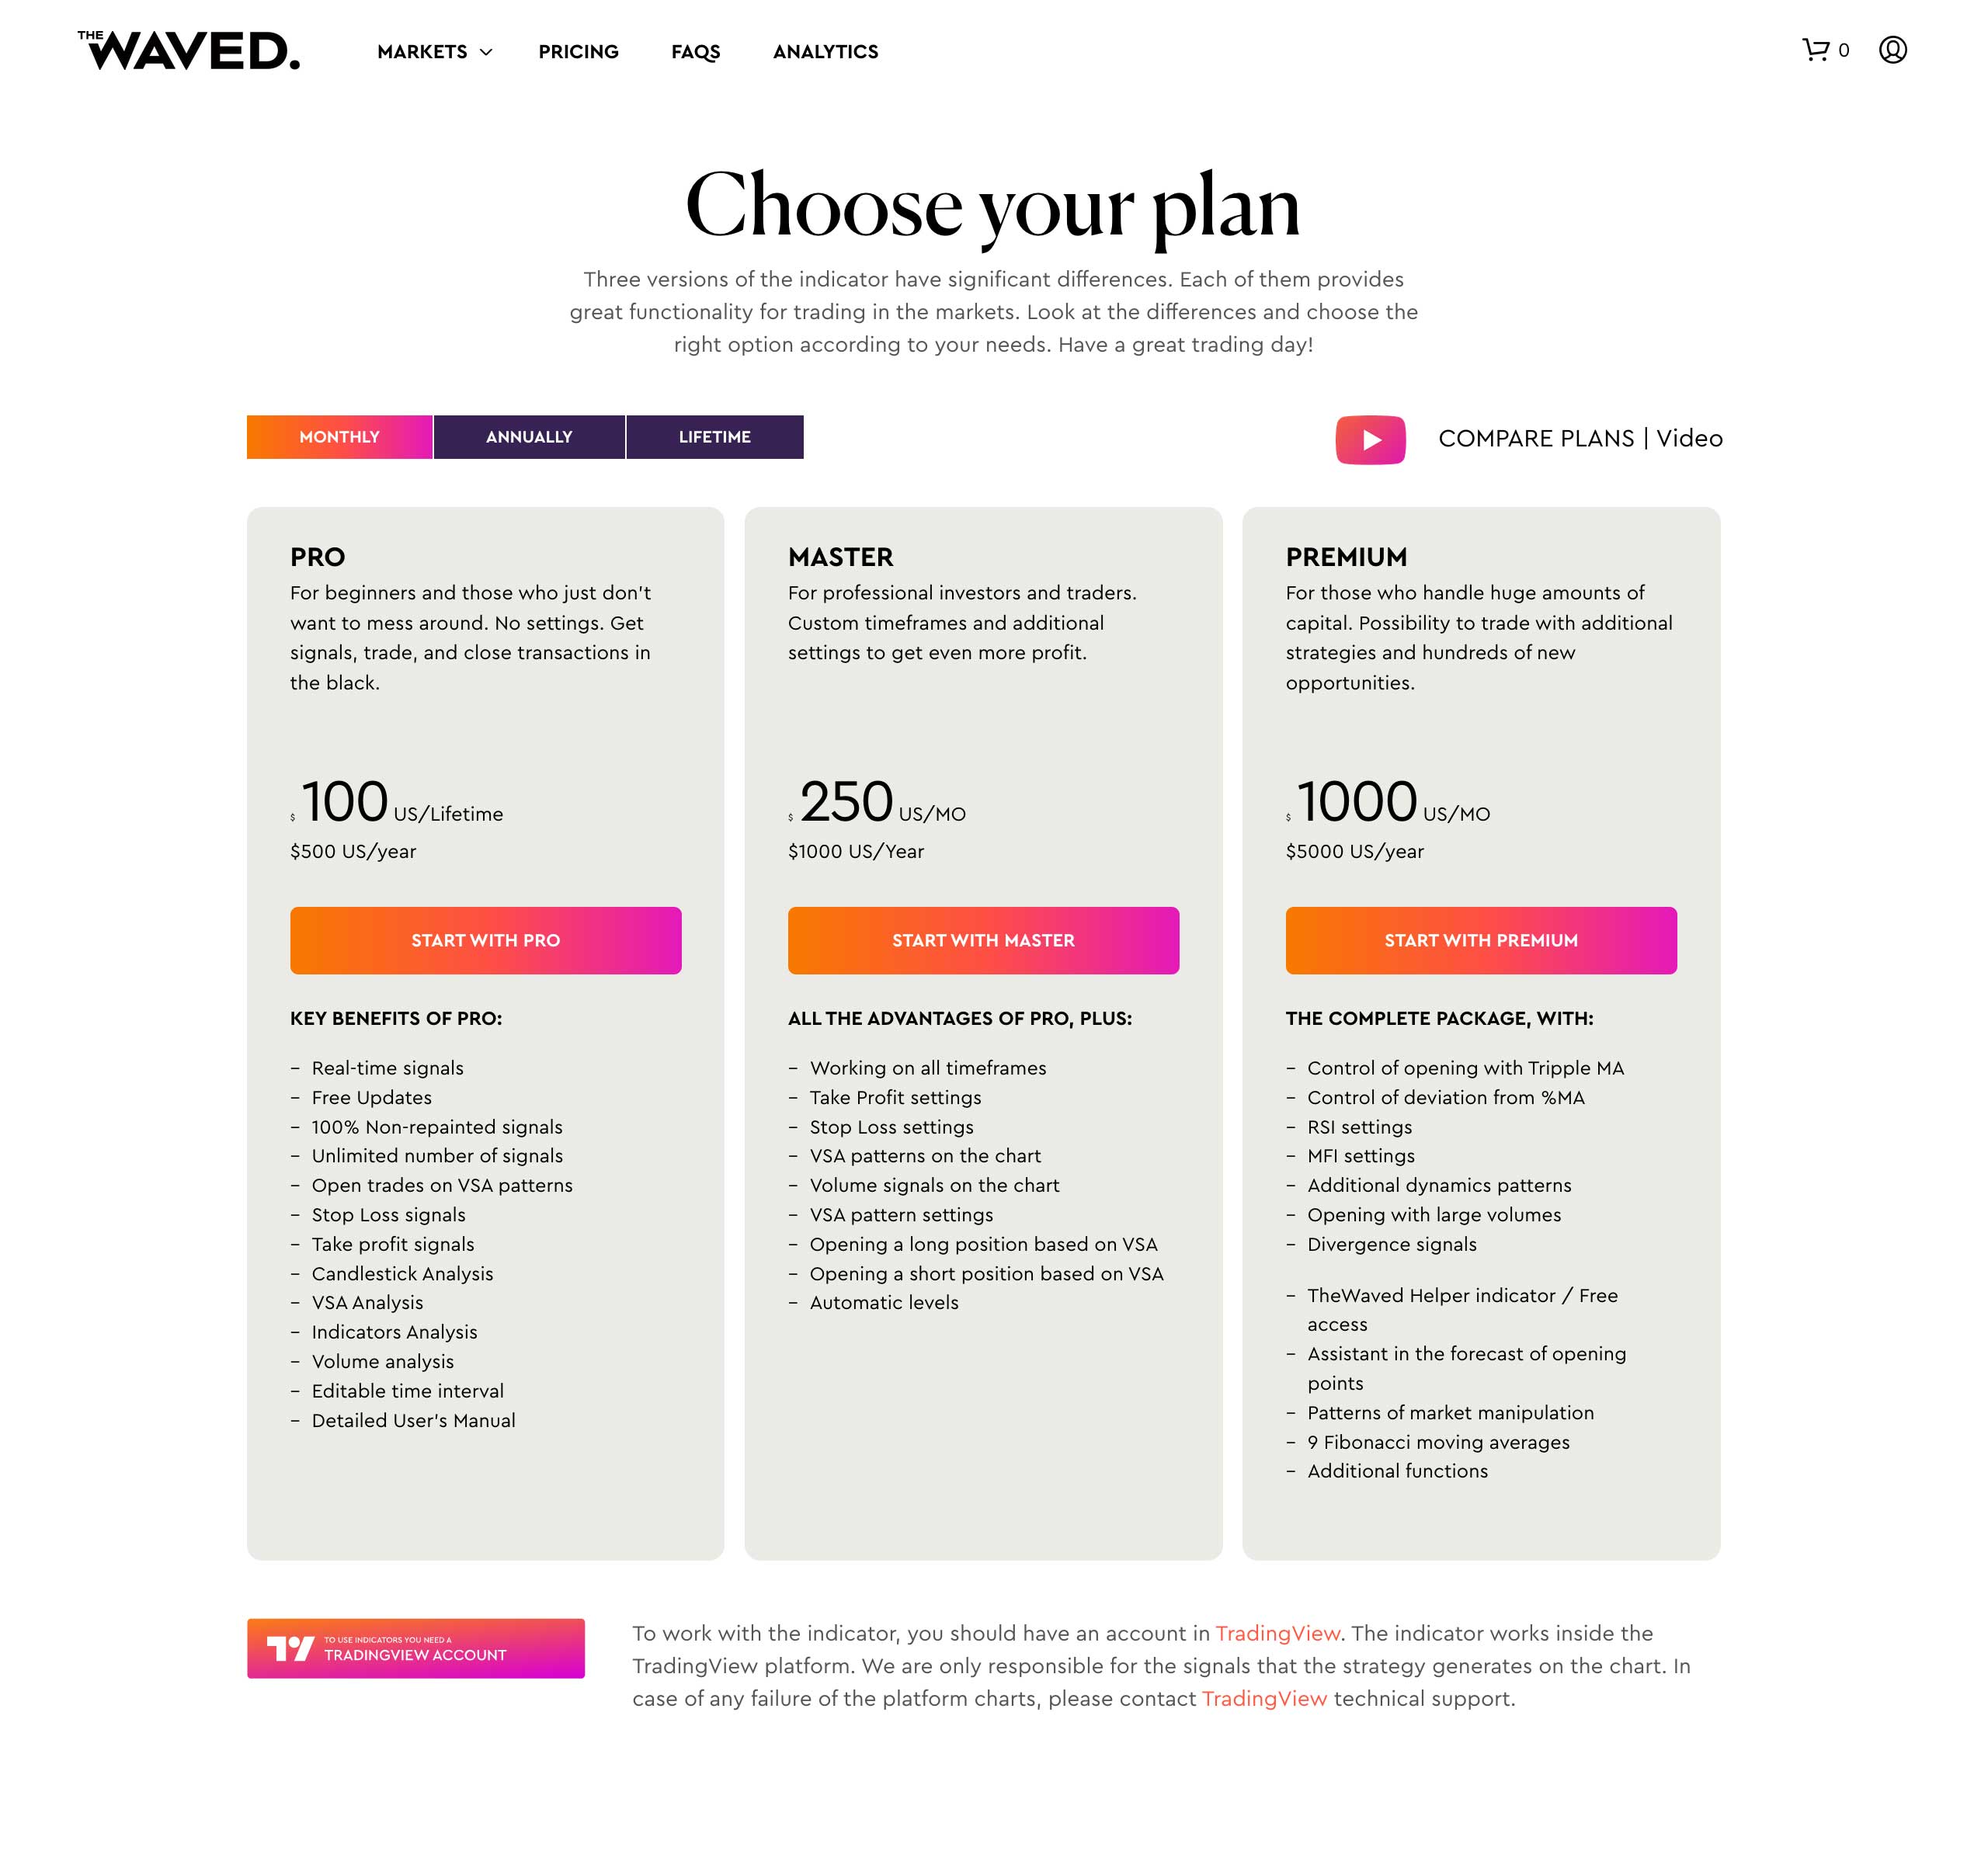
To subscribe to The Waved Indicator, go to the “Rate plans” section. There are three subscription options here, and you can also choose the period of time you want to buy access for: a month, a year or forever.
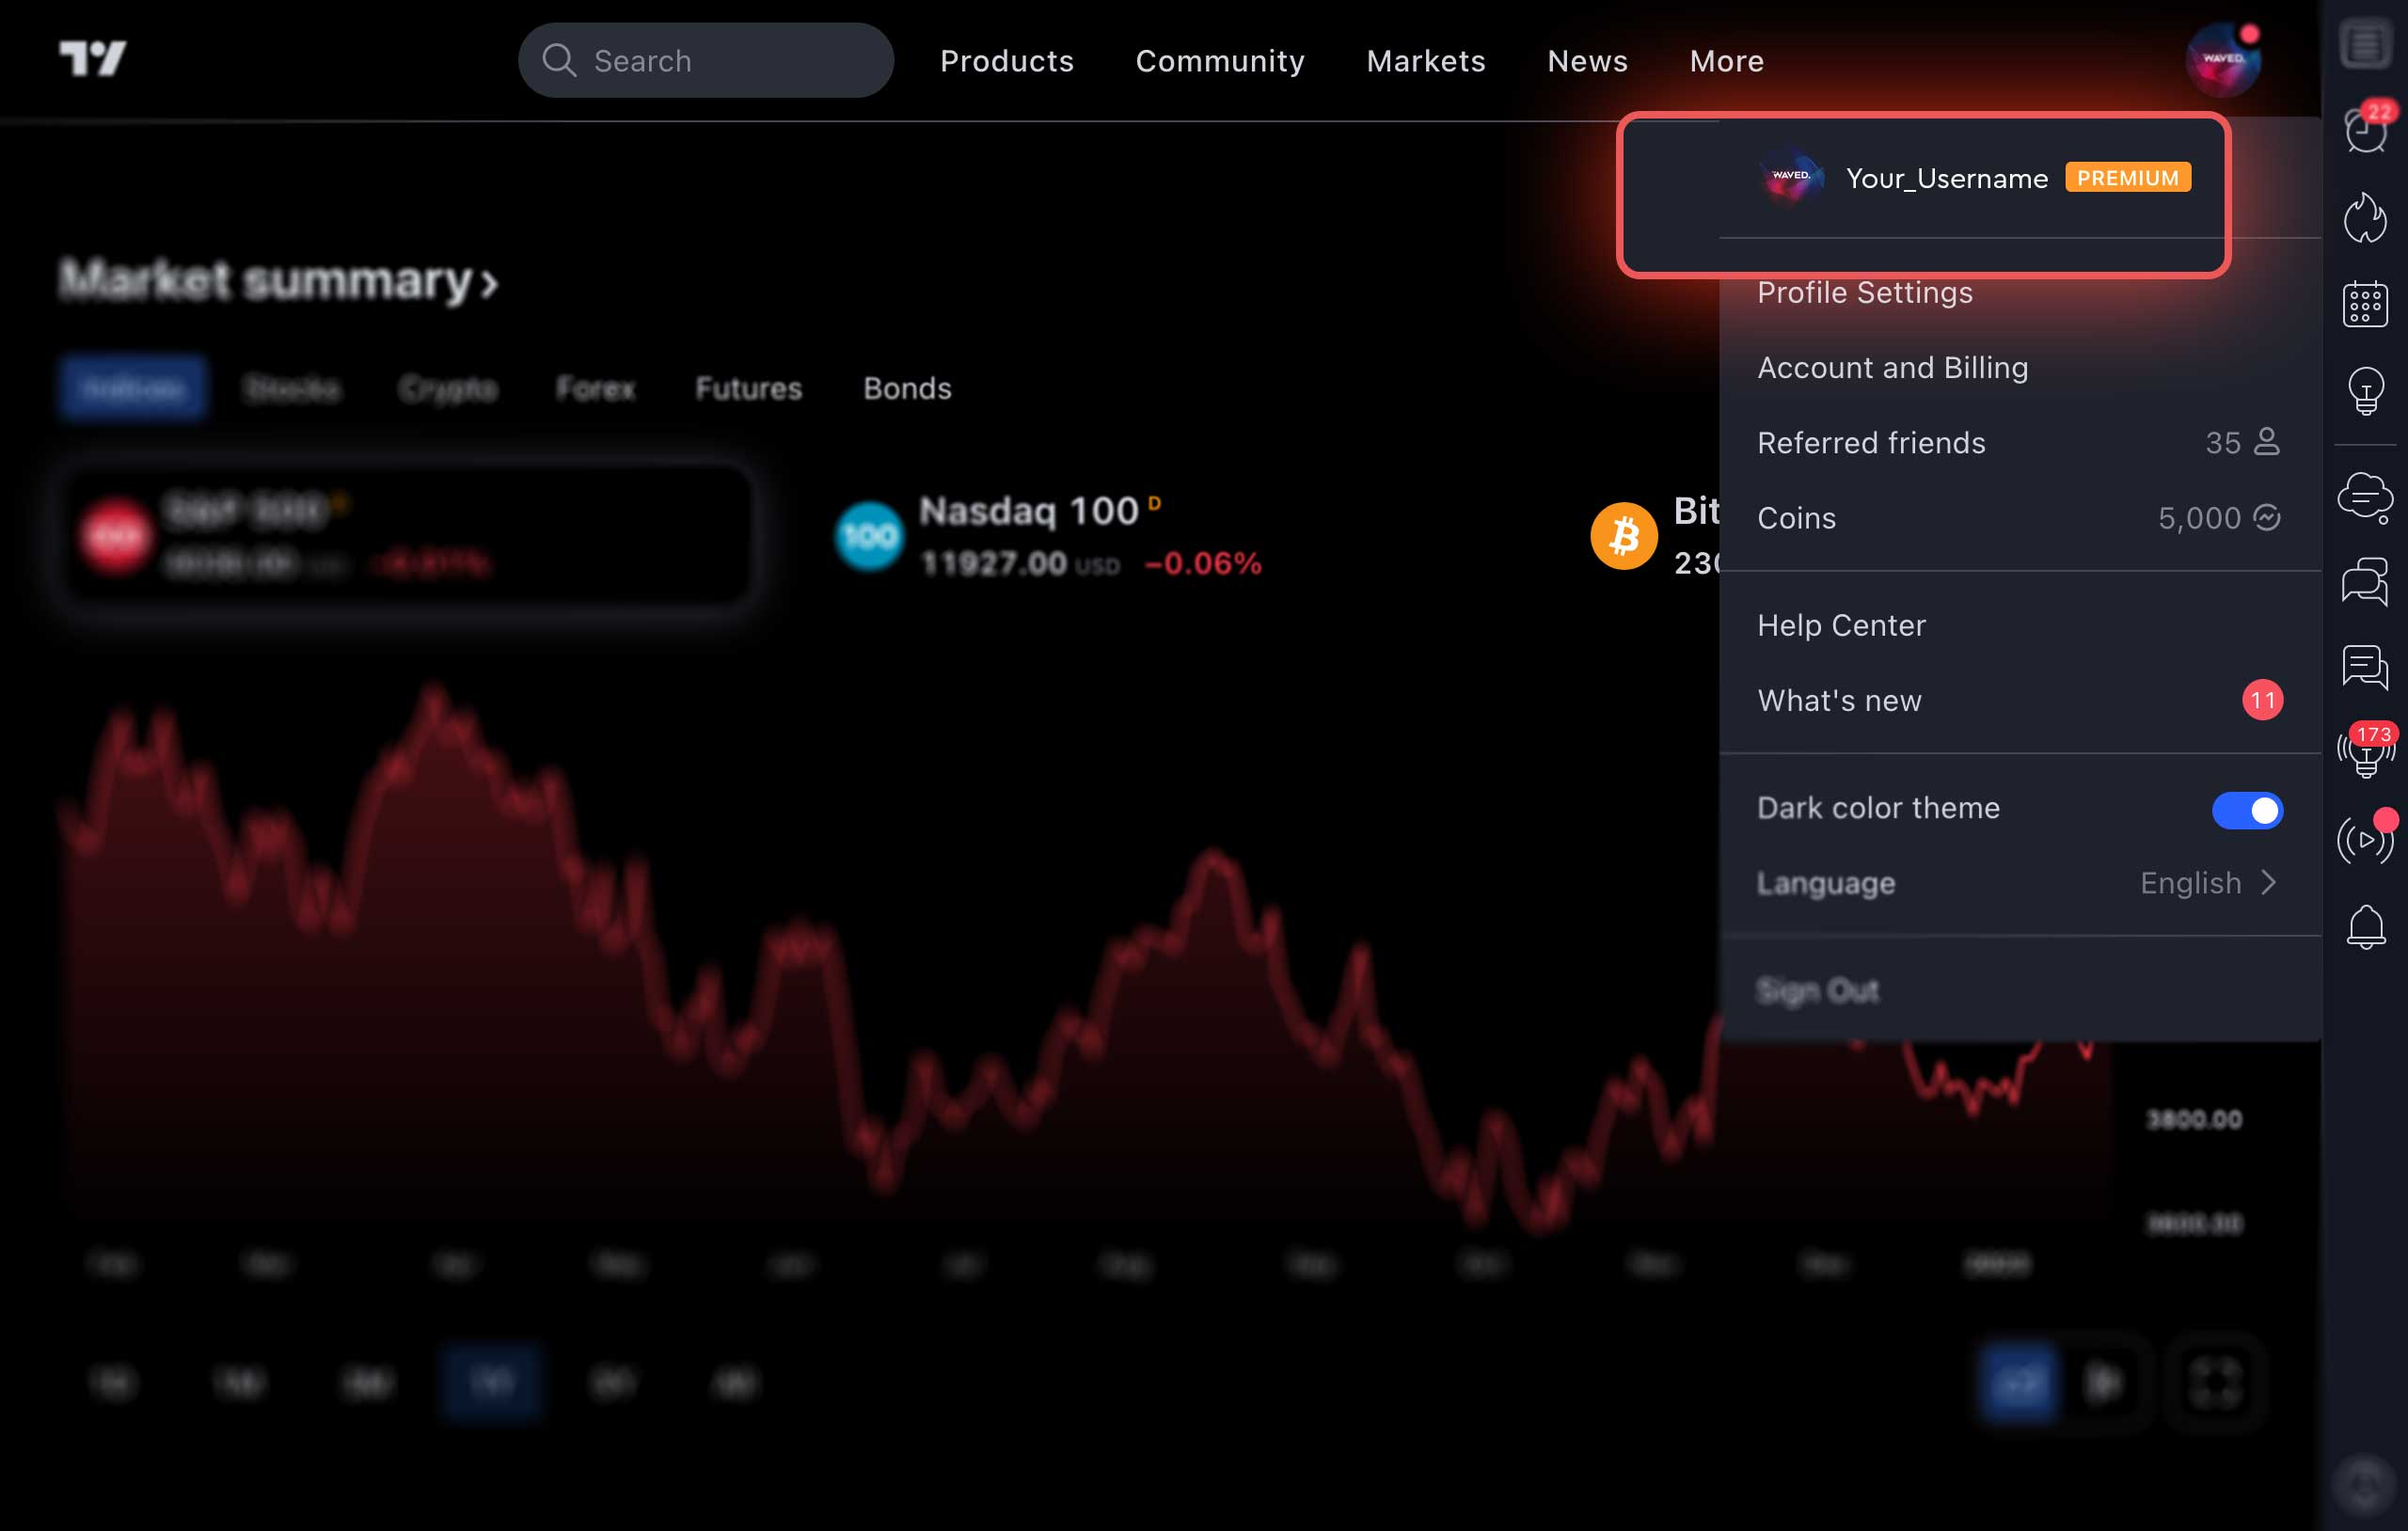
After you have decided on the rate plan, click “Add to cart.” Be sure to enter the name of your account in Tradingview. Don’t mix up – the name of your account is your username, not your email. If you forgot it, it’s better to go to Tradingview and copy it from there.
Payment methods
You entered your Tradingview login and opened the cart for payment. Here you need to enter your personal data: first name, last name, address, email, and so on. Then you choose a convenient payment method and accept the terms. Then click “Confirm order.”
PAYPAL PAYMENT
To pay for an order using PayPal, you need to select the appropriate icon and tick the “I accept the terms” checkbox. Then choose how you want to pay: directly via PayPal or using a bank card. If you choose to pay directly, a window will appear on the screen where you will need to log in to your PayPal account and confirm the payment. If you choose to pay with a bank card, you will need to enter its details. After you click “Pay”, the funds will be automatically debited from your account.
PAYMENT IN CRYPTOCURRENCY
To pay for an order with cryptocurrency, you need to select the corresponding payment method, check “I accept the terms”, and then click “Proceed to Coinbase”. You will be redirected to the Coinbase website. Here you need to click “Pay with Coinbase” button. In the pop-up window, you will need to log in to your Coinbase account and pay for the order using the selected cryptocurrency. If you do not have an account on this exchange, you will need to create one. Important point: if you are in Russia, you will not be able to buy cryptocurrency here. But it can be transferred here from your wallet.
PAYING FOR ORDER FROM YOUR ACCOUNT
If for some reason you could not pay for your subscription right away, then you can do it in your personal account. Open the “Orders” section and click “Pay.” The payment screen will open, where you can also choose a convenient method for you and pay for the purchase.
Working with Tradingview
All basic questions about working with Tradingview.
Applying the indicator to the chart
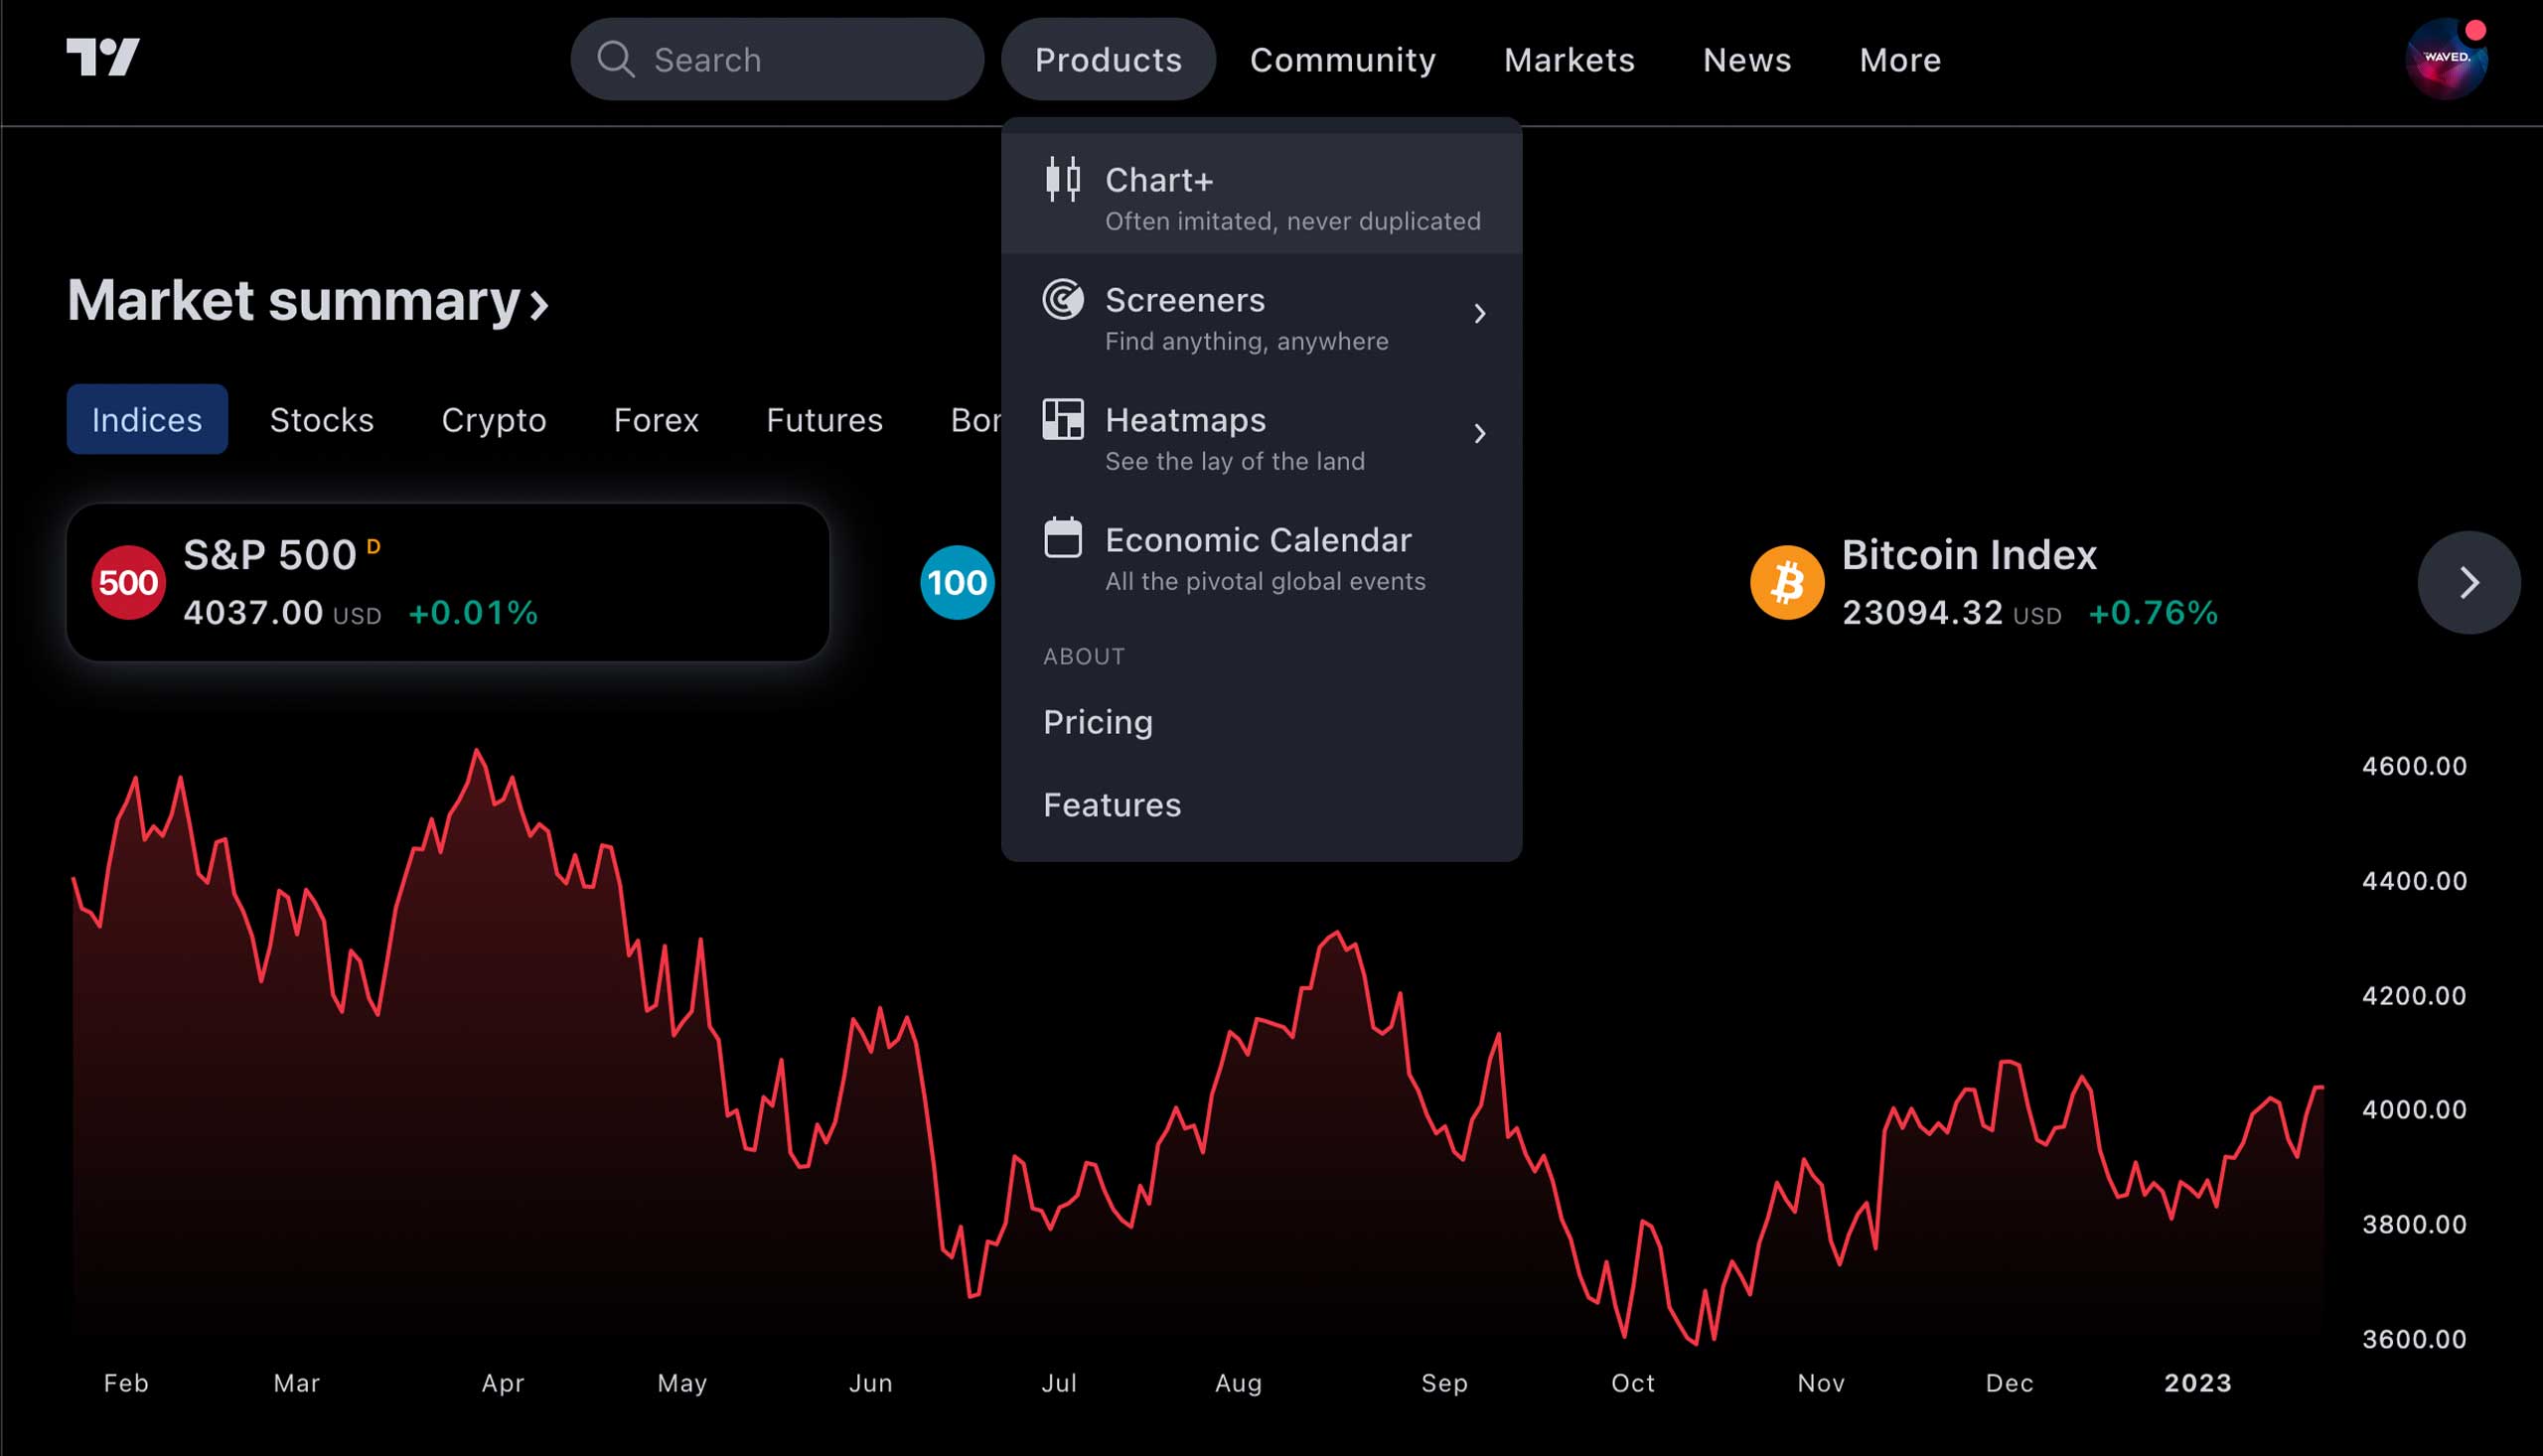
After you have gained access to the indicator, you need to log in to Tradingview again. On the main page in the Products tab, select the “Chart+”.
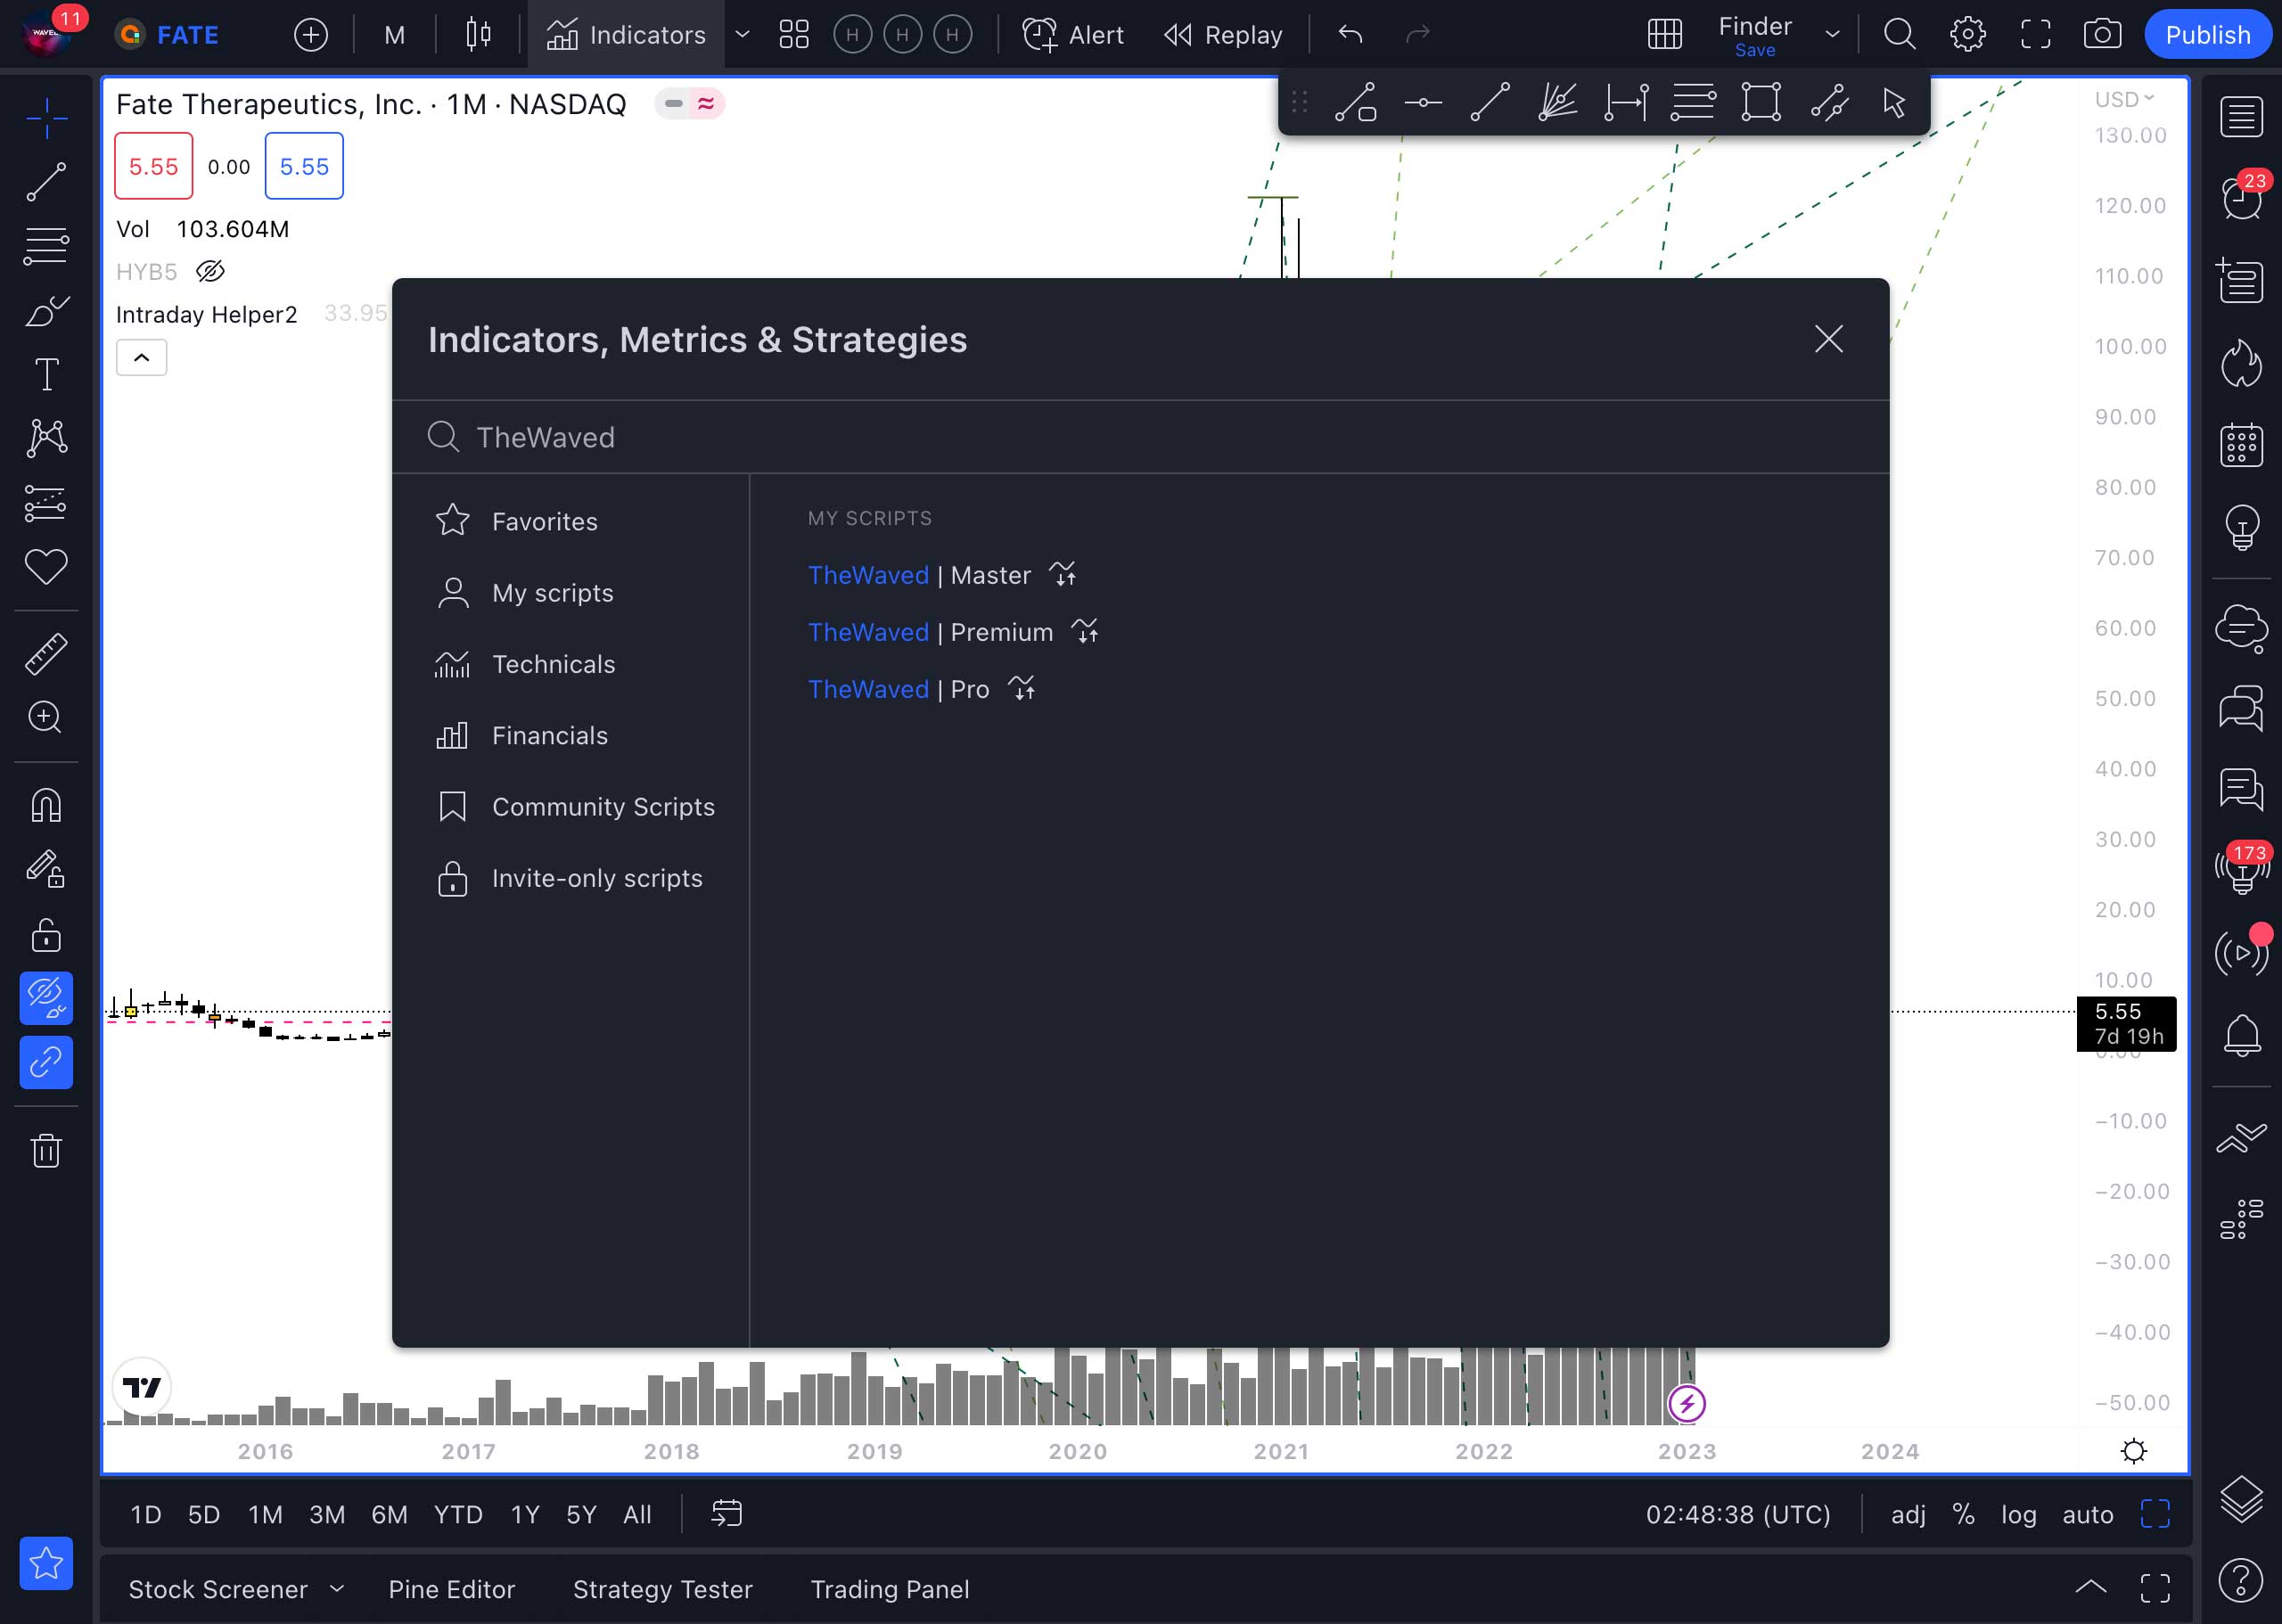
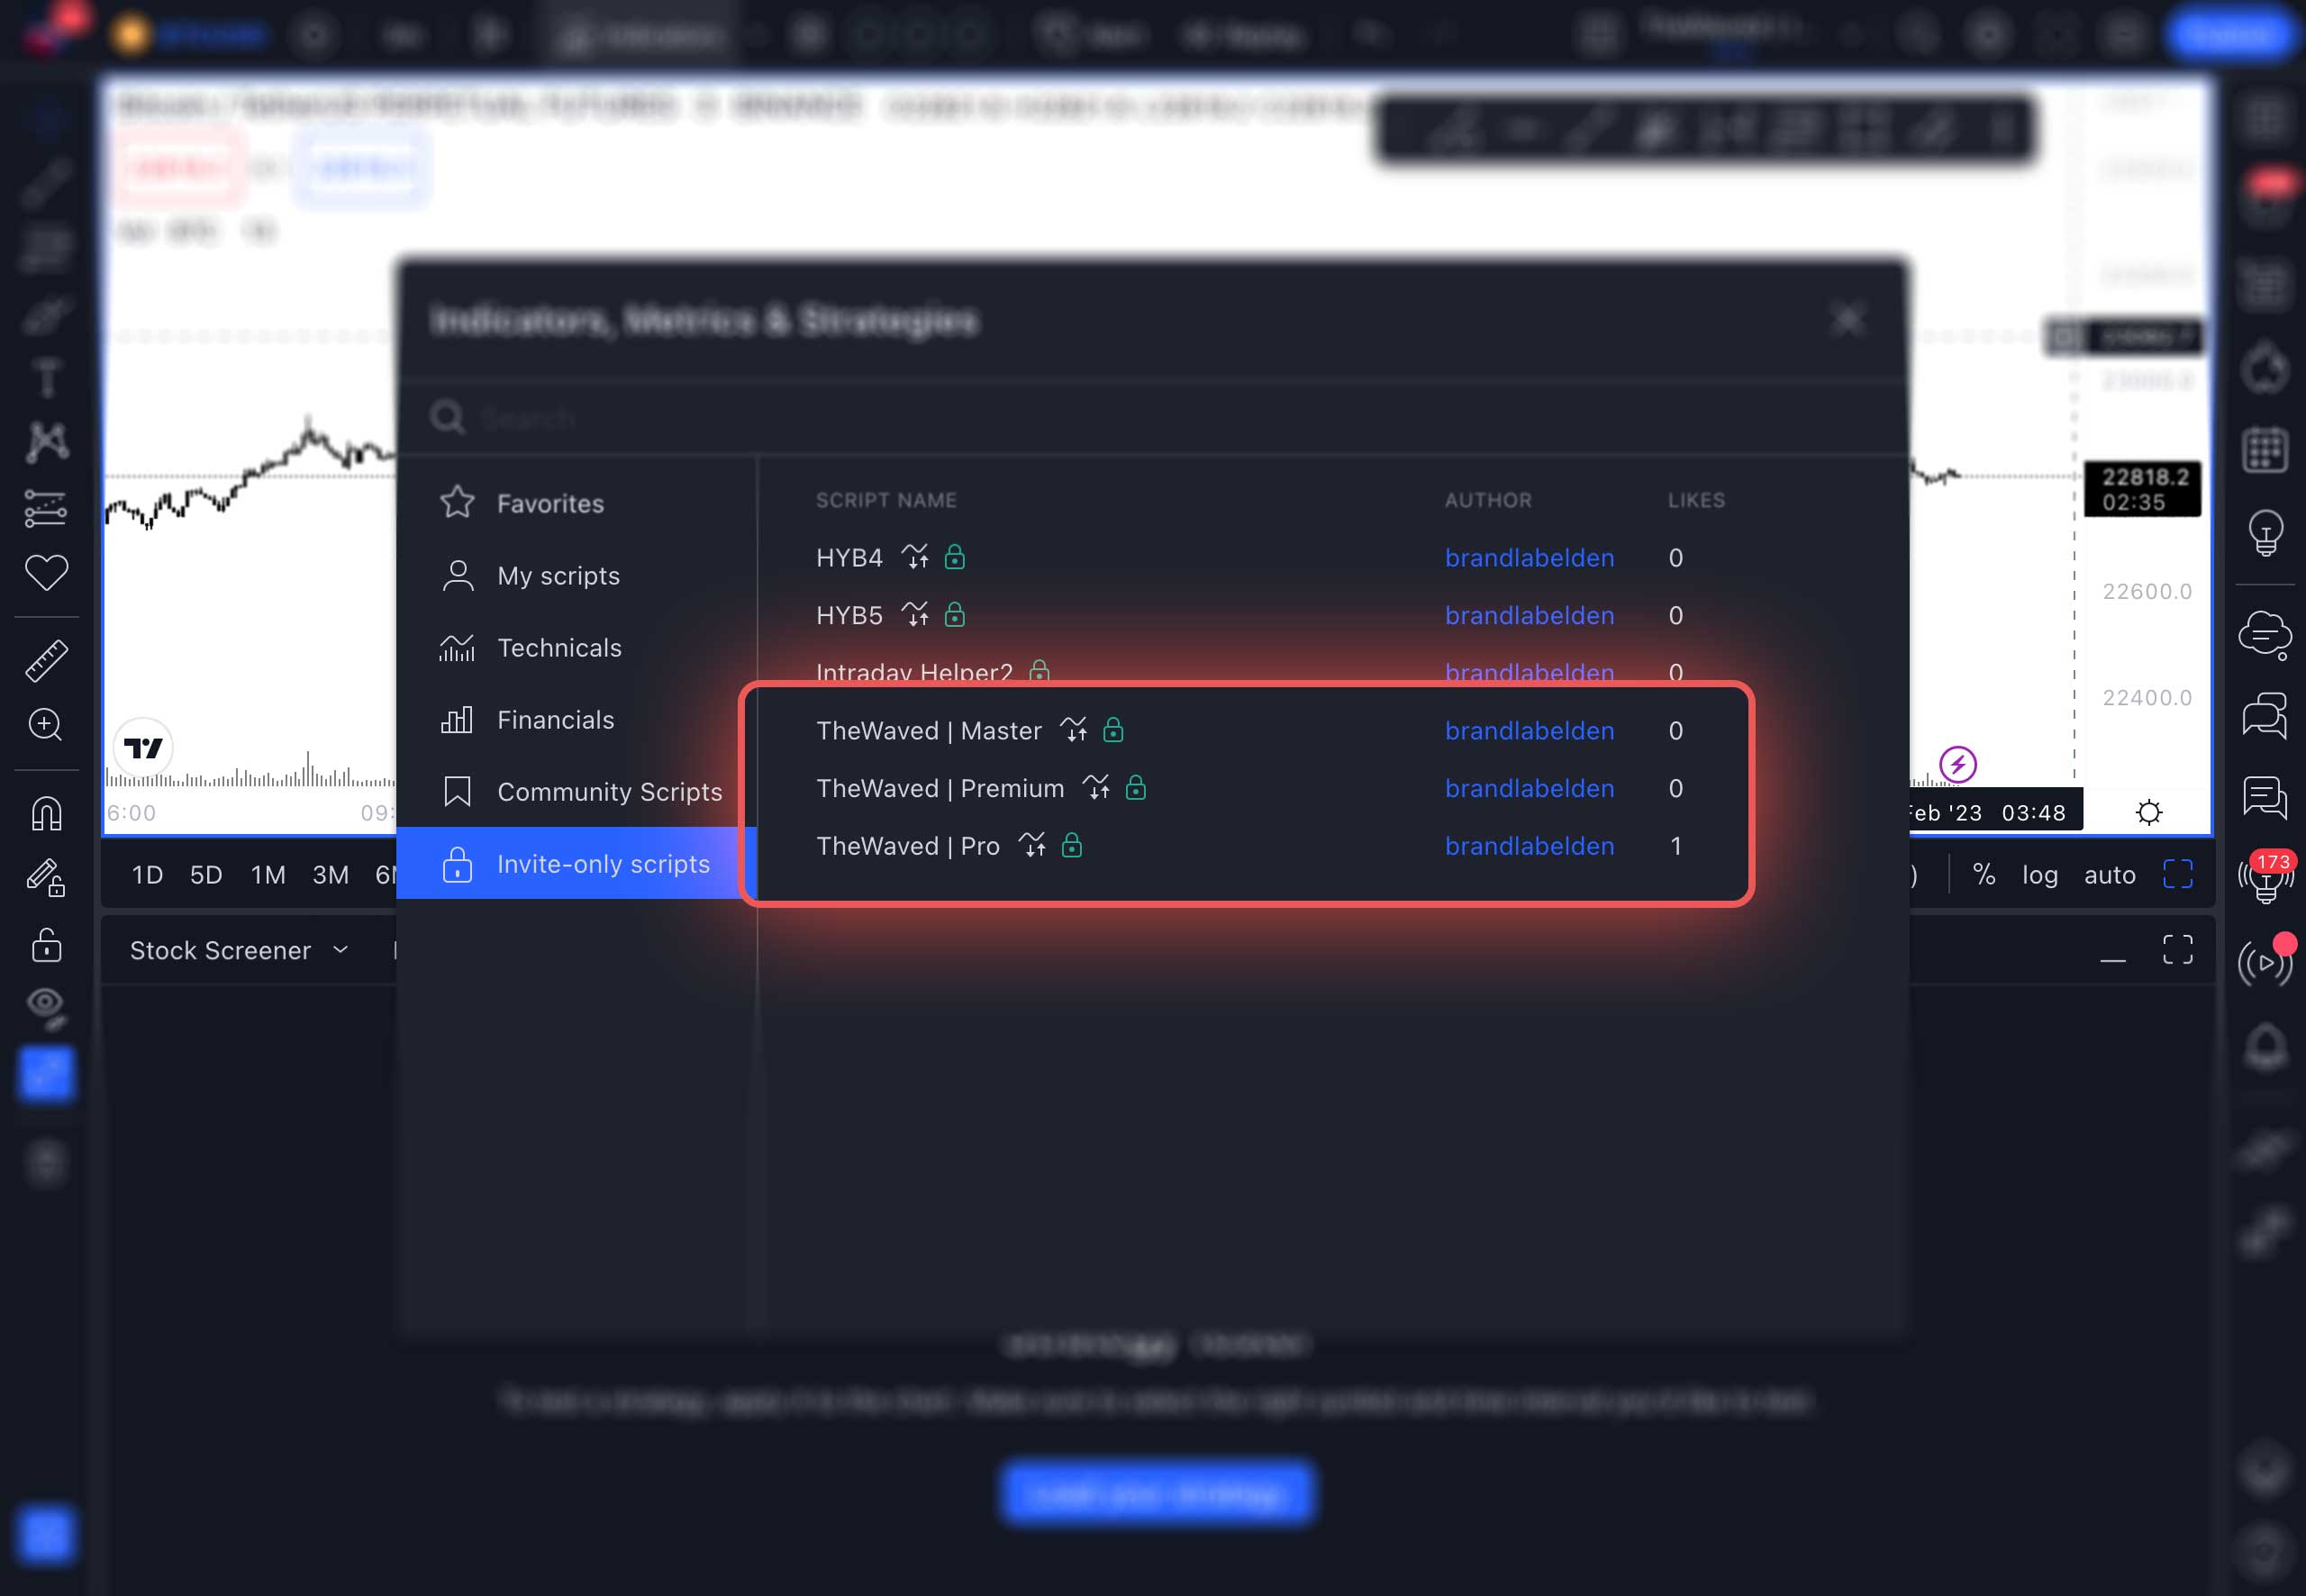
Once you have chosen a trading pair, you are ready to apply the indicator. To do this, select “Invite-only scripts” (Scripts with limited access) in the “Indicators” section and click on TheWaved | Pro/Master/Premium. Now you can close the window, the indicator is applied. After that, you need to save the chart, and it will always be available.
ASSET SELECTION
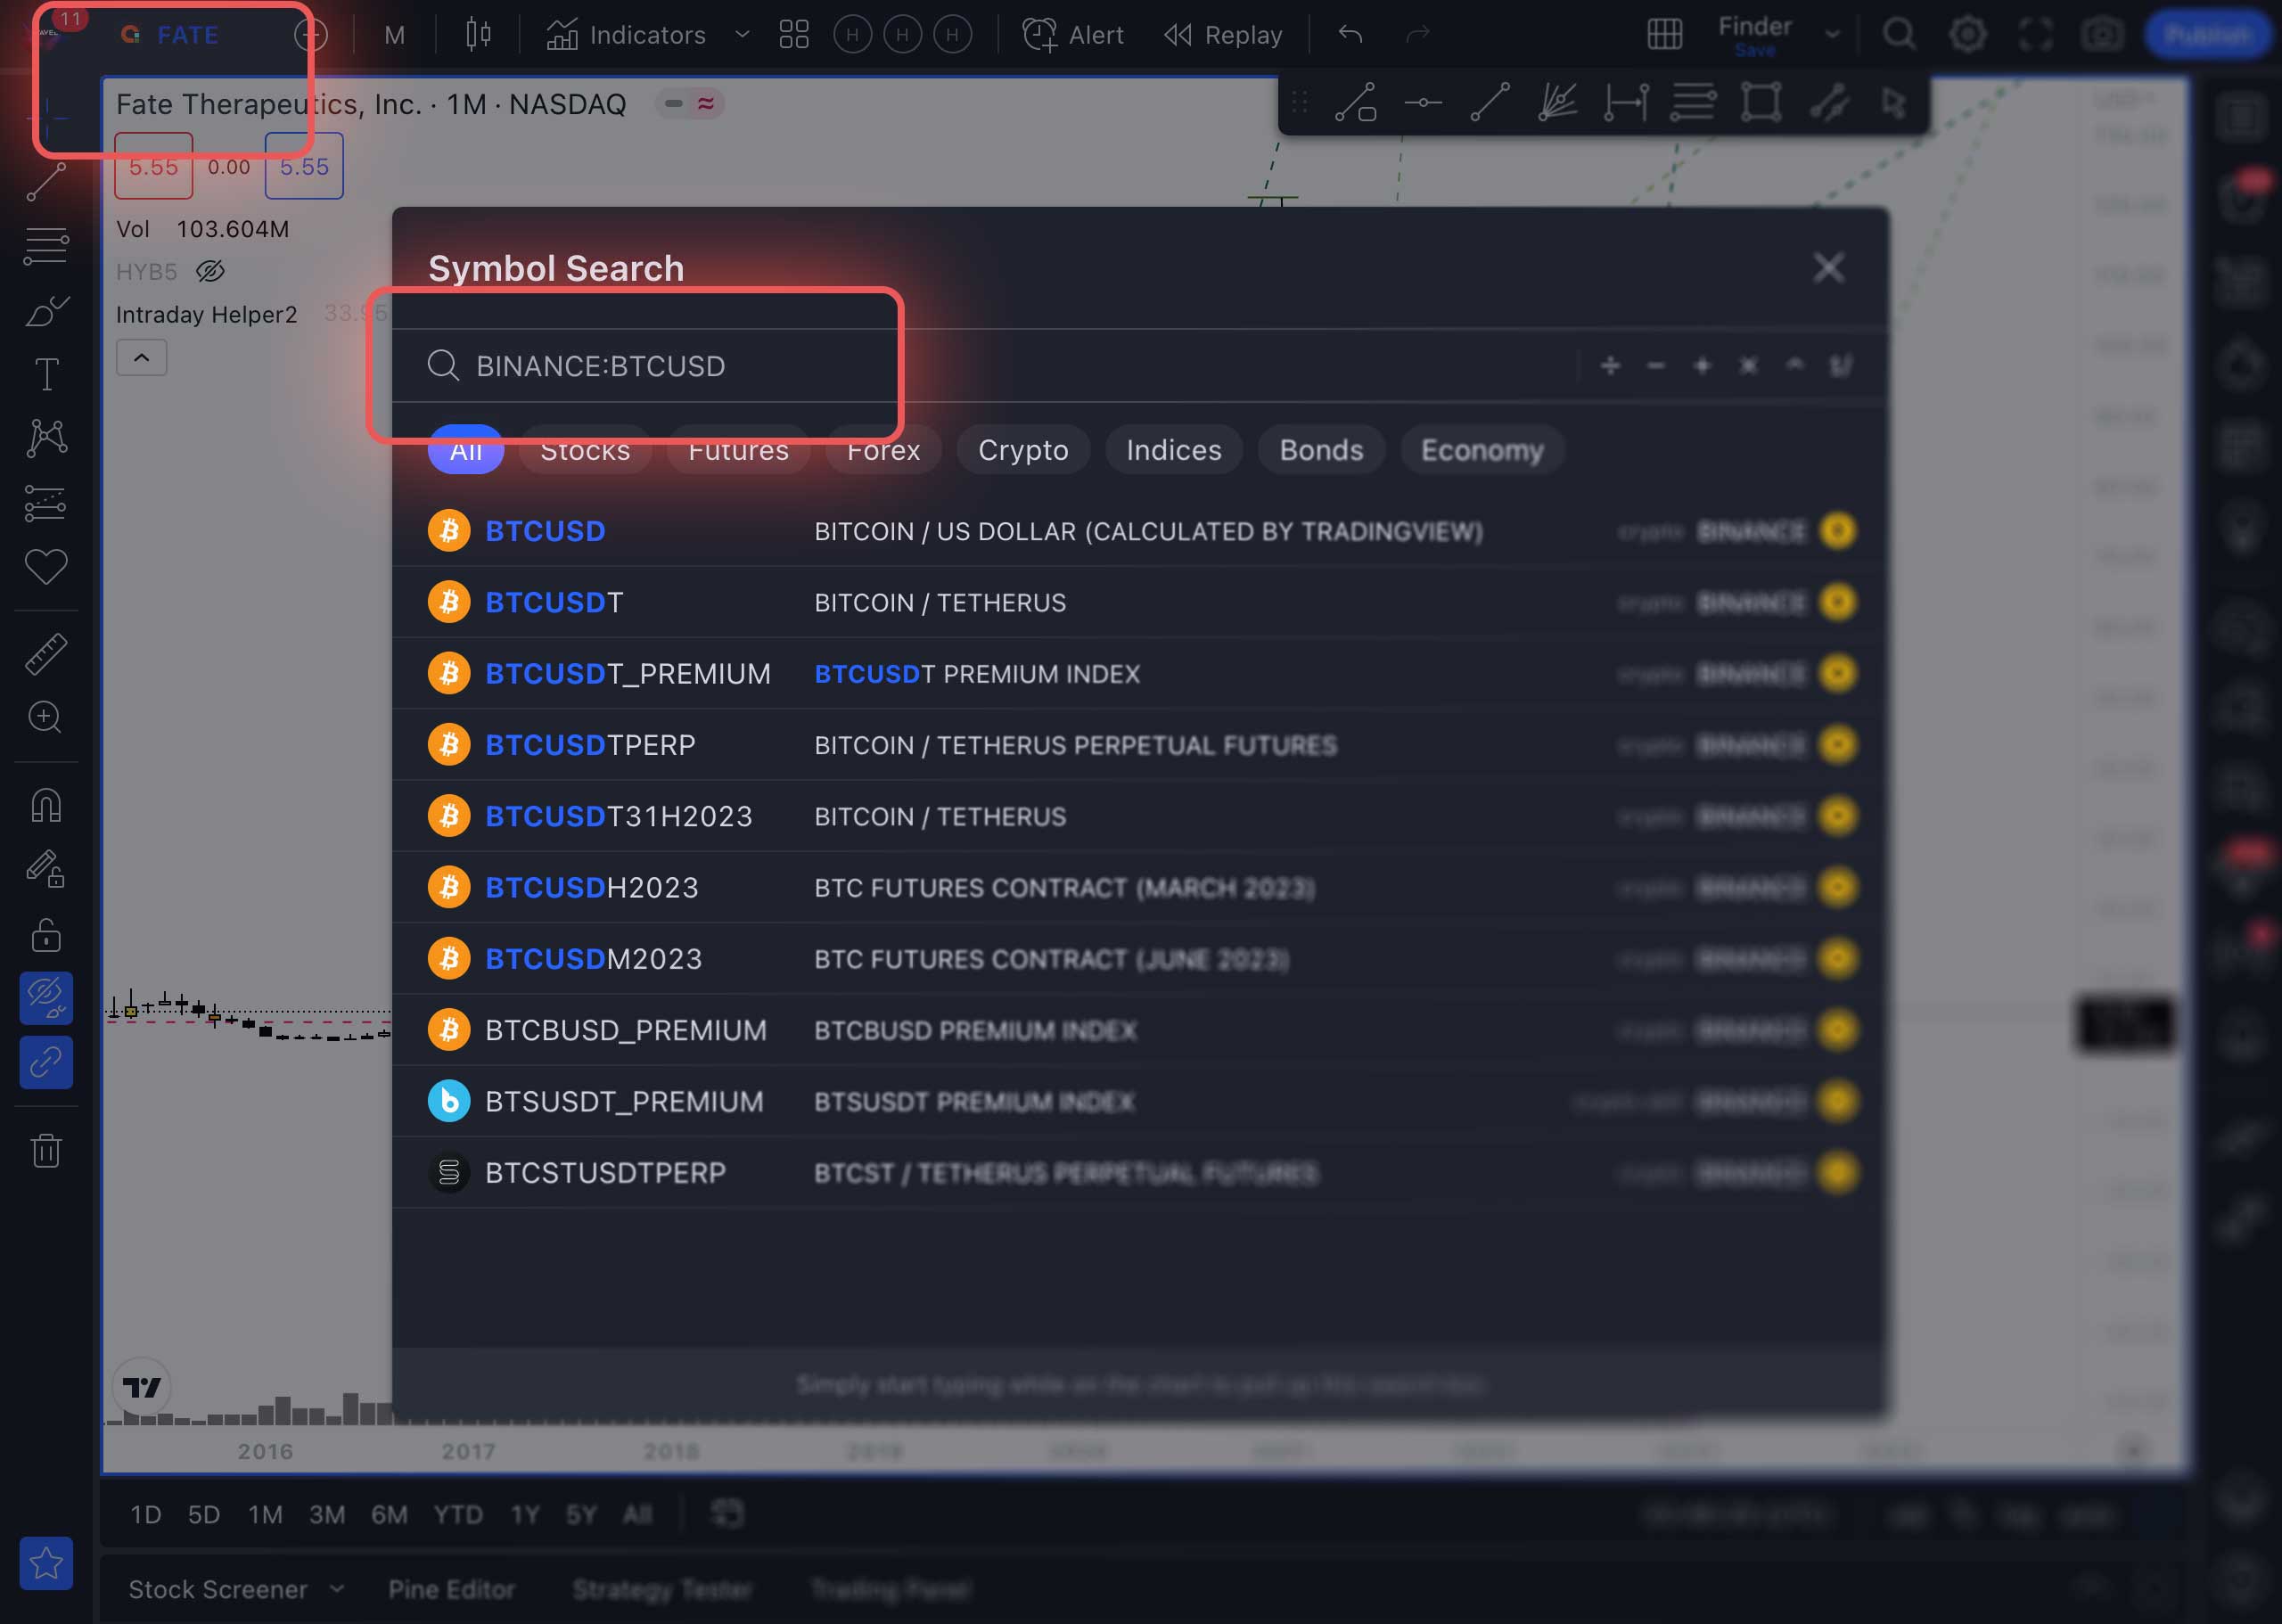
In the upper left corner you can select an asset. Carefully review the suggested options, and choose the one that suits best for you. For example, if you want to trade cryptocurrency on Binance, then you need to select this exchange in the right list. It is also important to choose the right pair. BTC USD and BTC USD are different trading pairs. The choice of a pair depends on which stablecoin or currency you will conduct transactions with. If you want to trade stocks, then choose the appropriate pair on the right exchange.
Adding Alerts
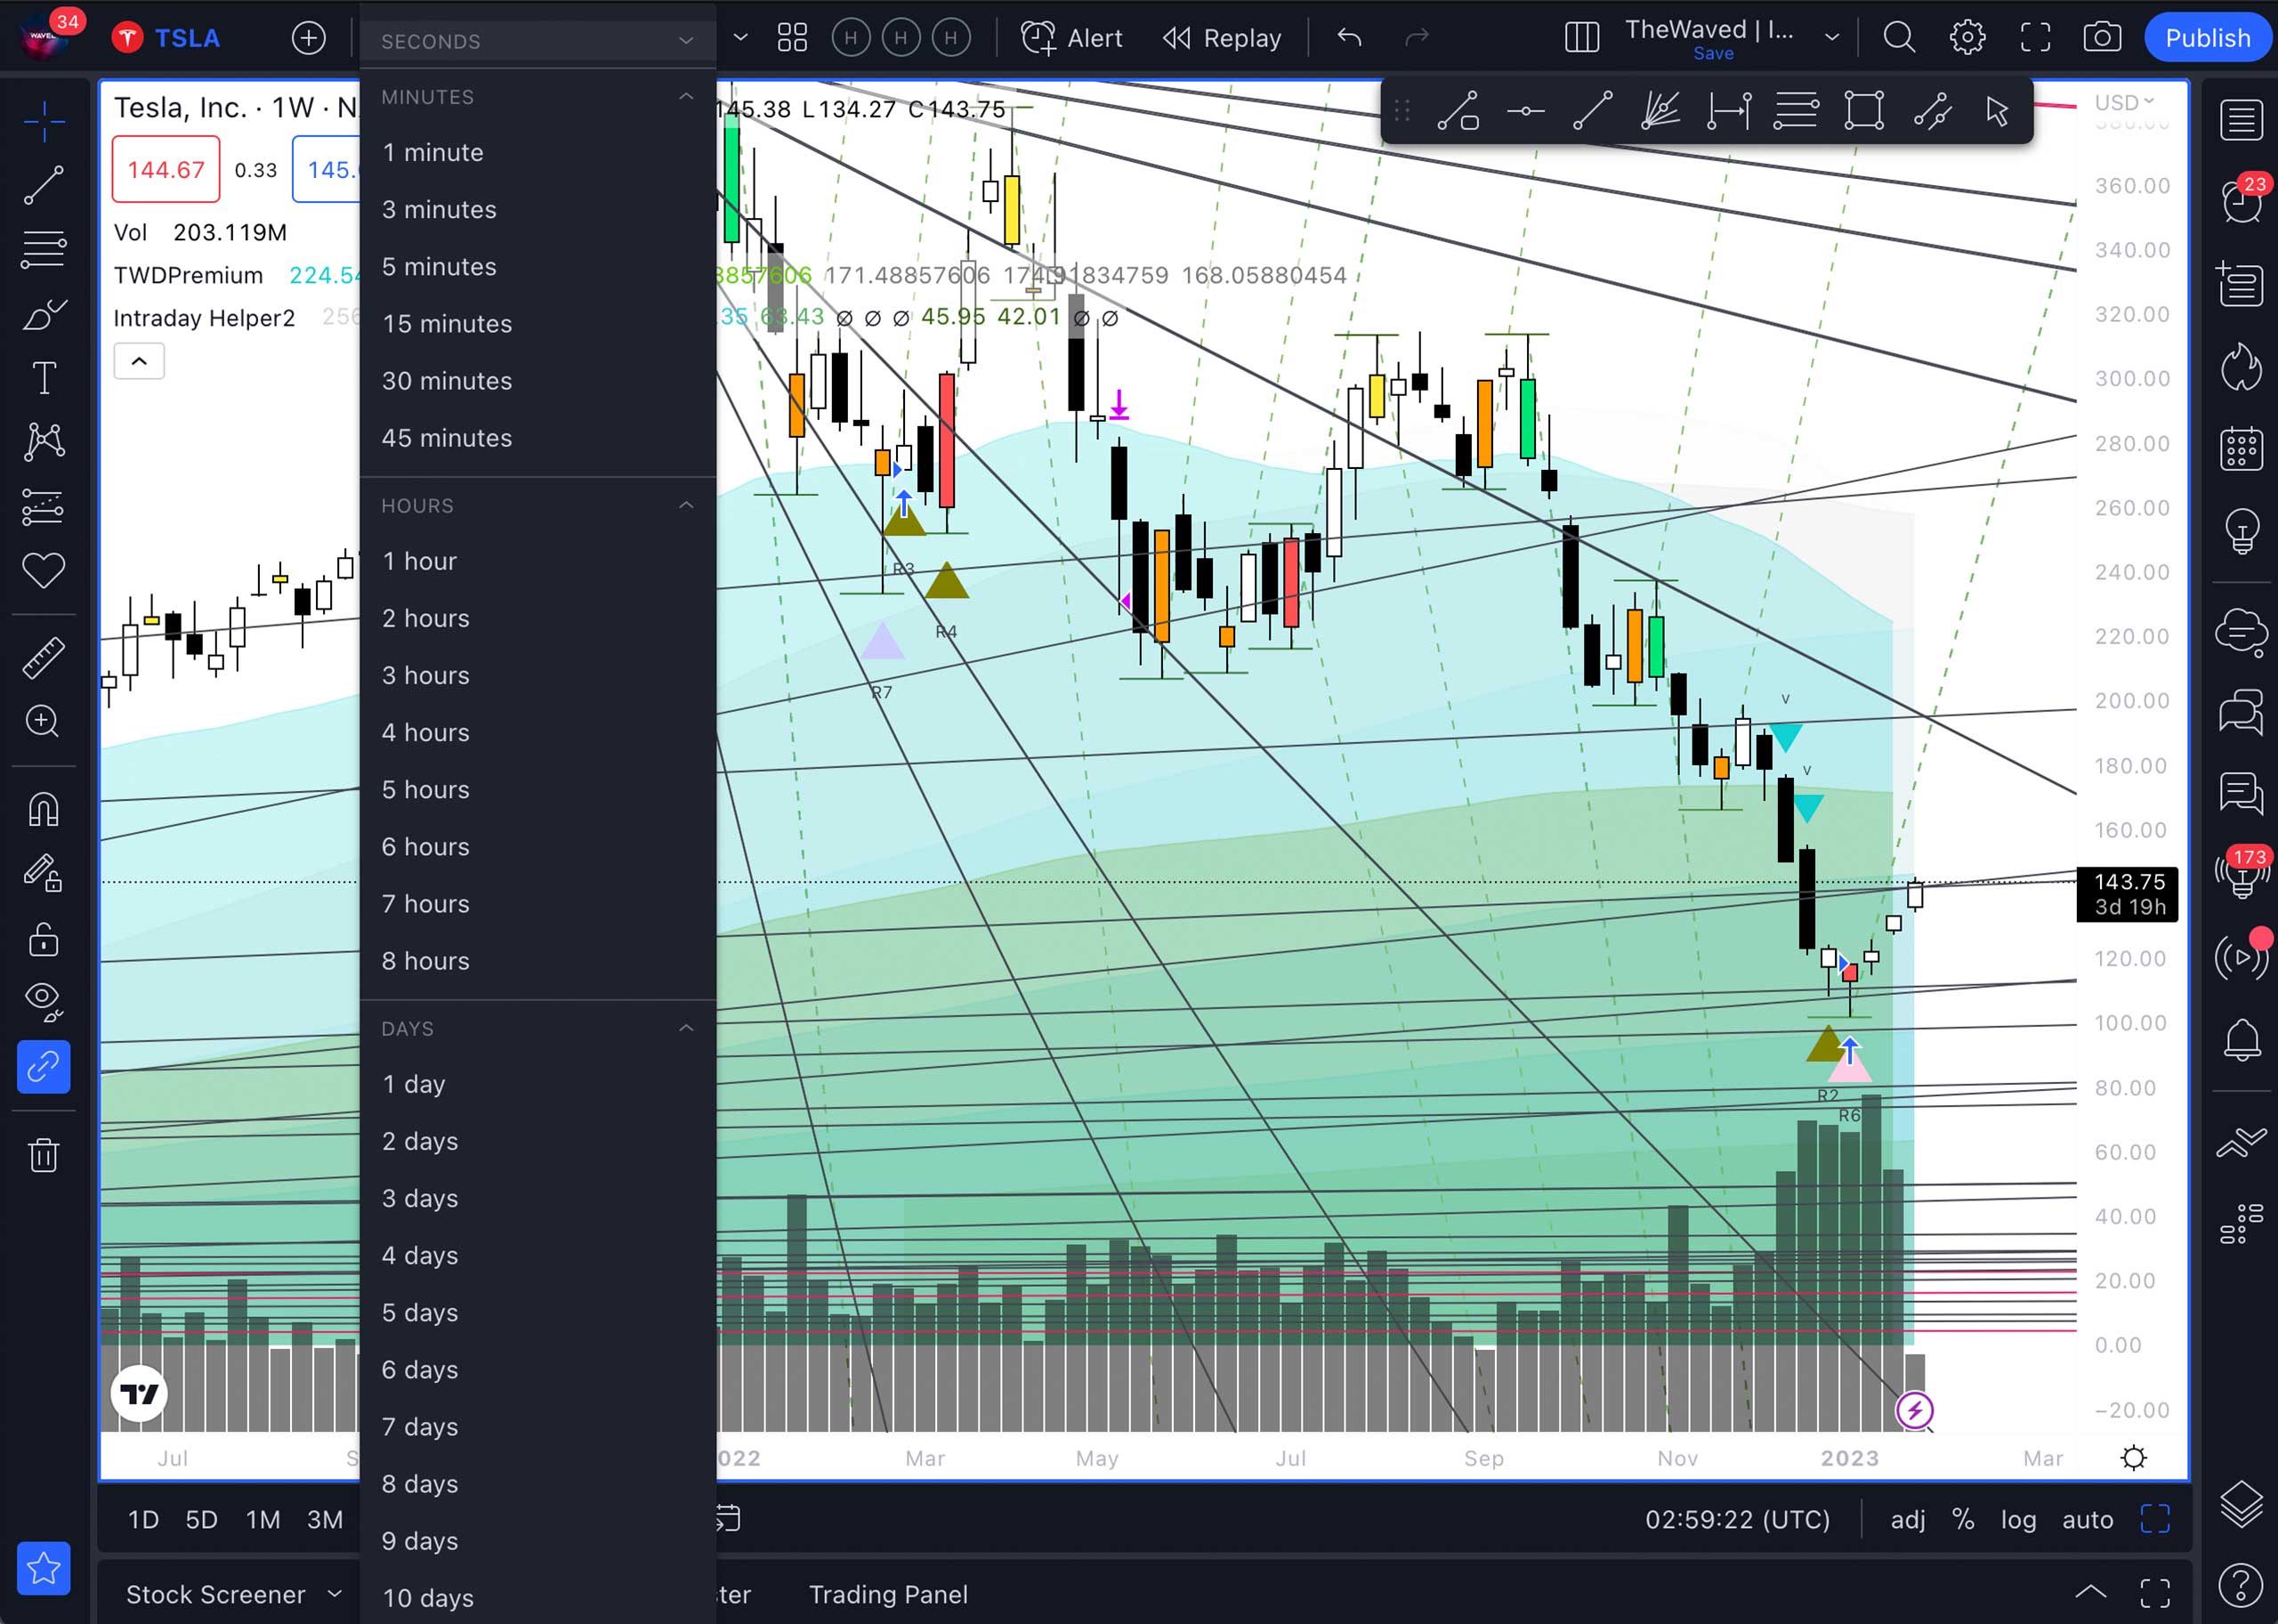
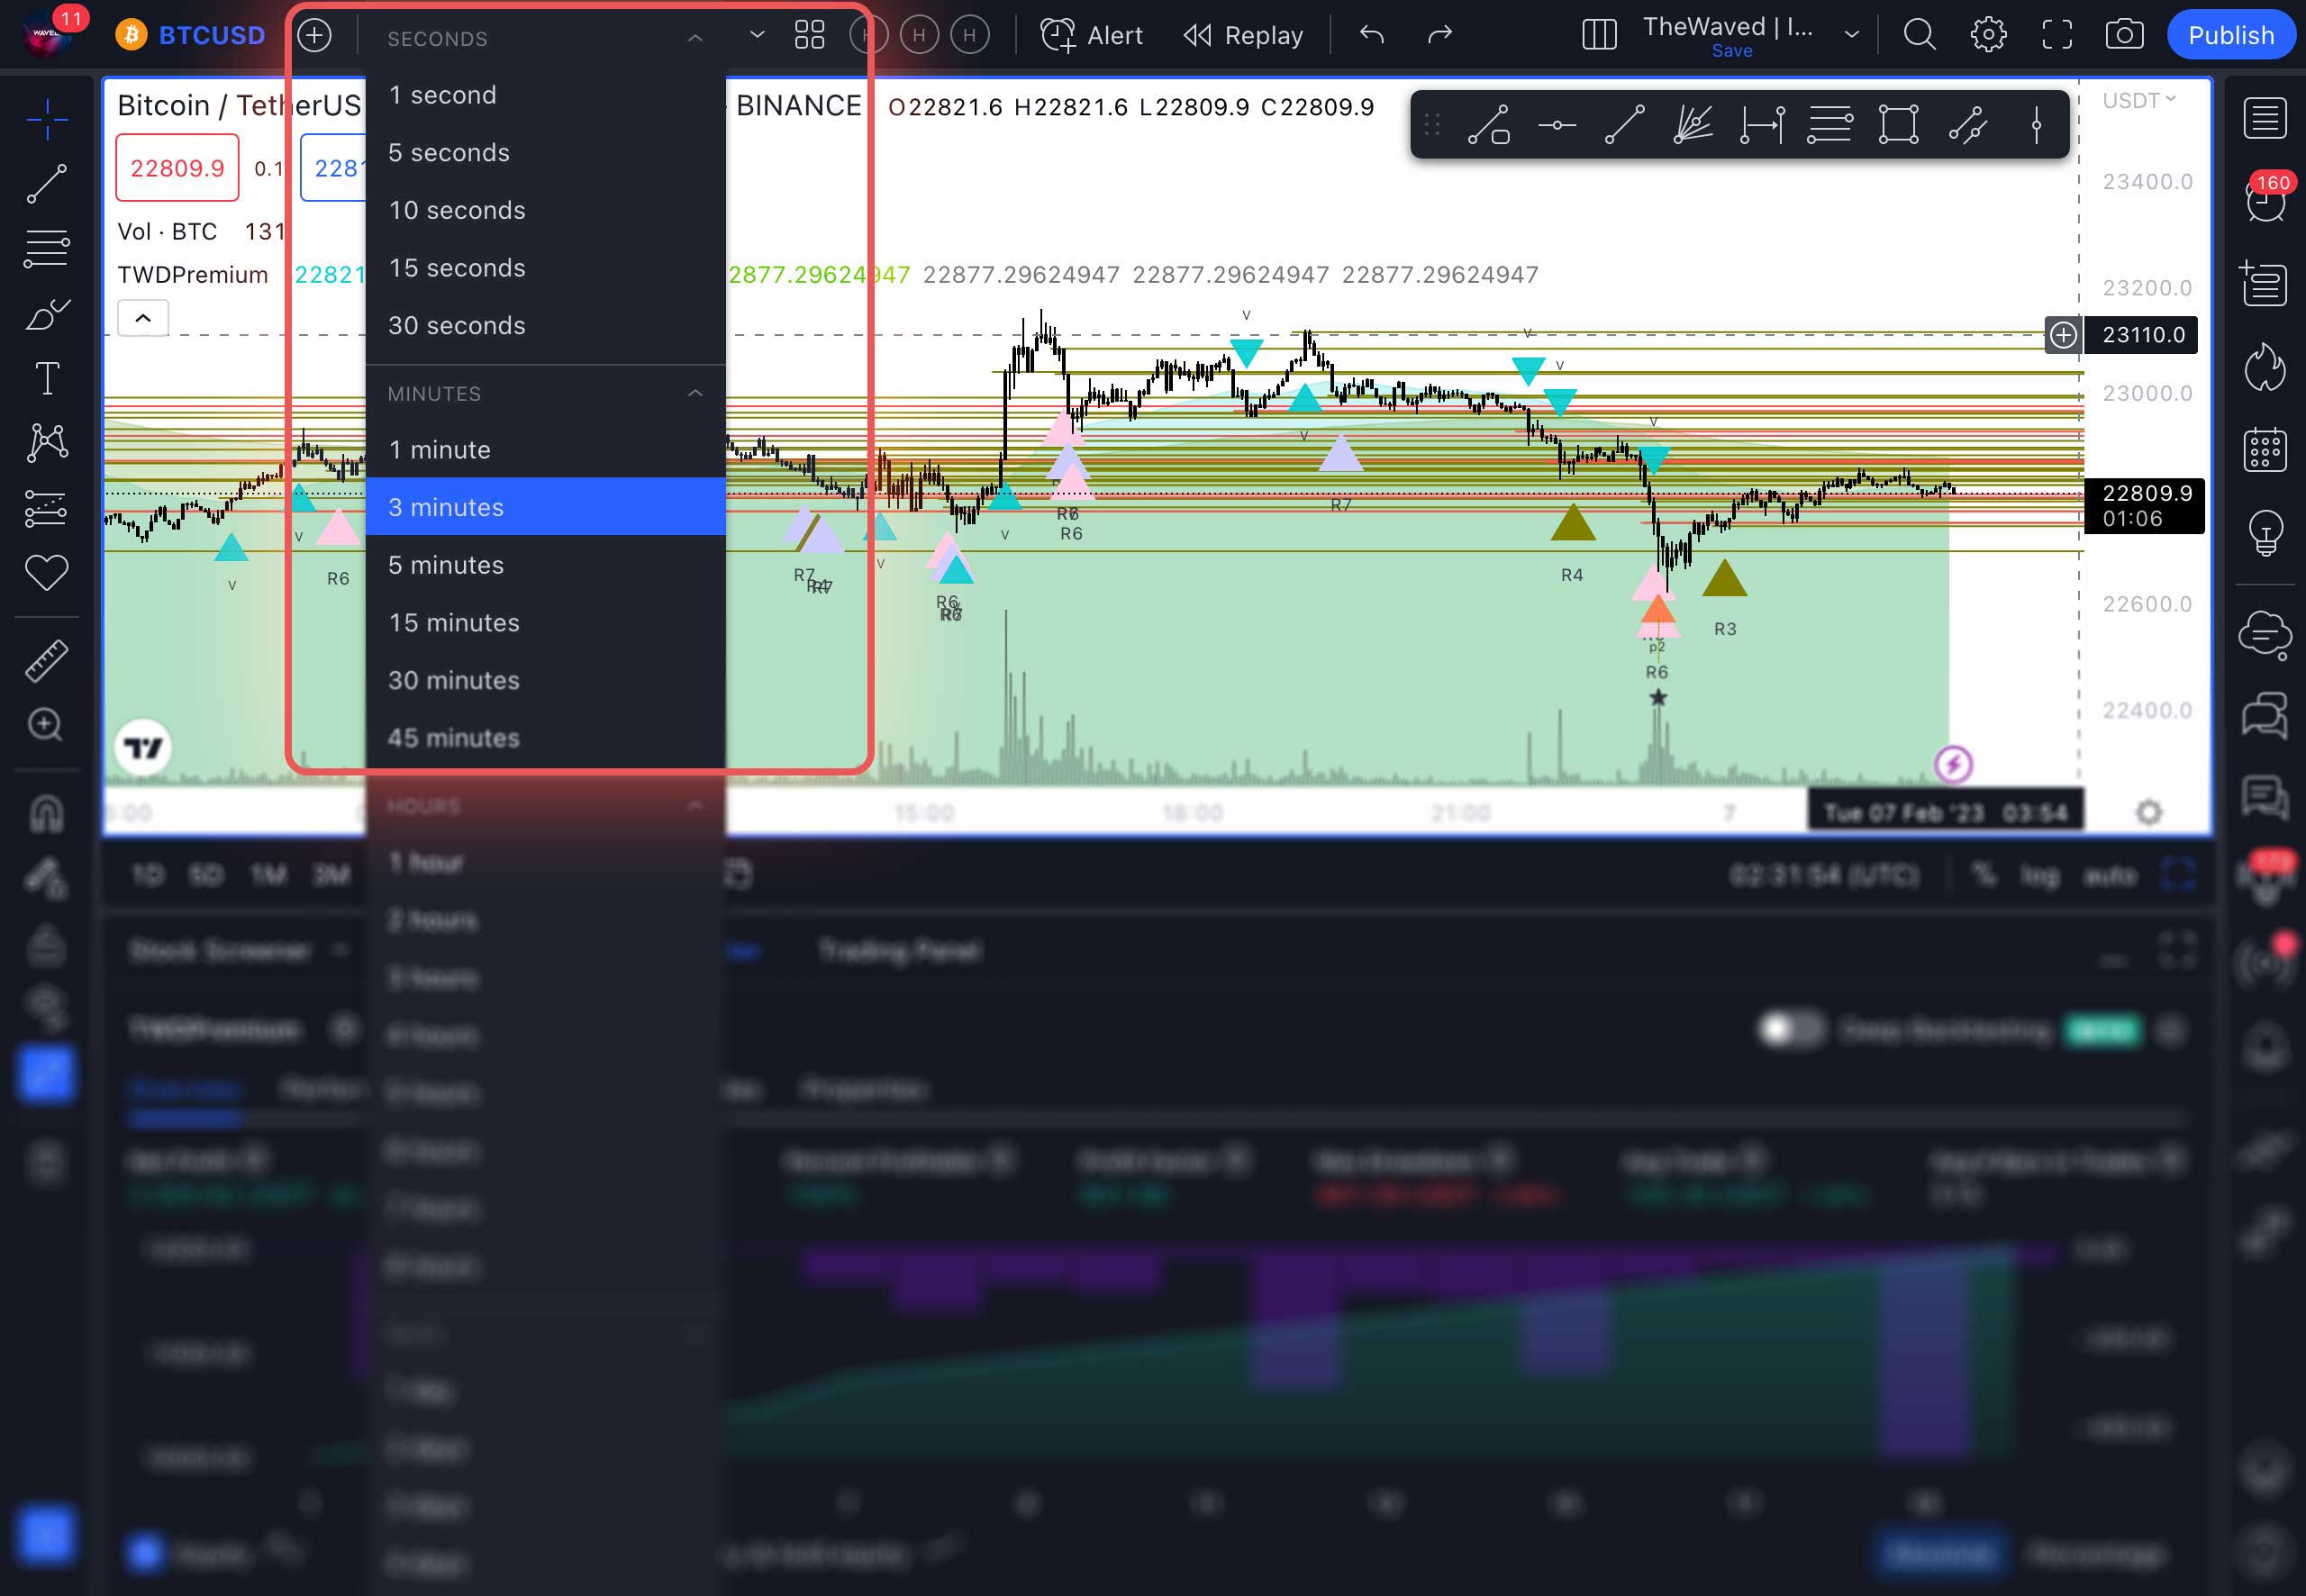
In order to set up signals, you first need to select a timeframe. It is located in the upper left corner next to the name of the trading pair. Timeframes are different and signals can be configured for each of them. Timeframes with a small interval, for example 5 minutes, are most suitable for professional traders. Signals of monthly timeframes can indicate global movements and market reversals. 45-minute, 1 hour or daily timeframes are suitable for getting acquainted with trading. Choose a timeframe depending on your needs.
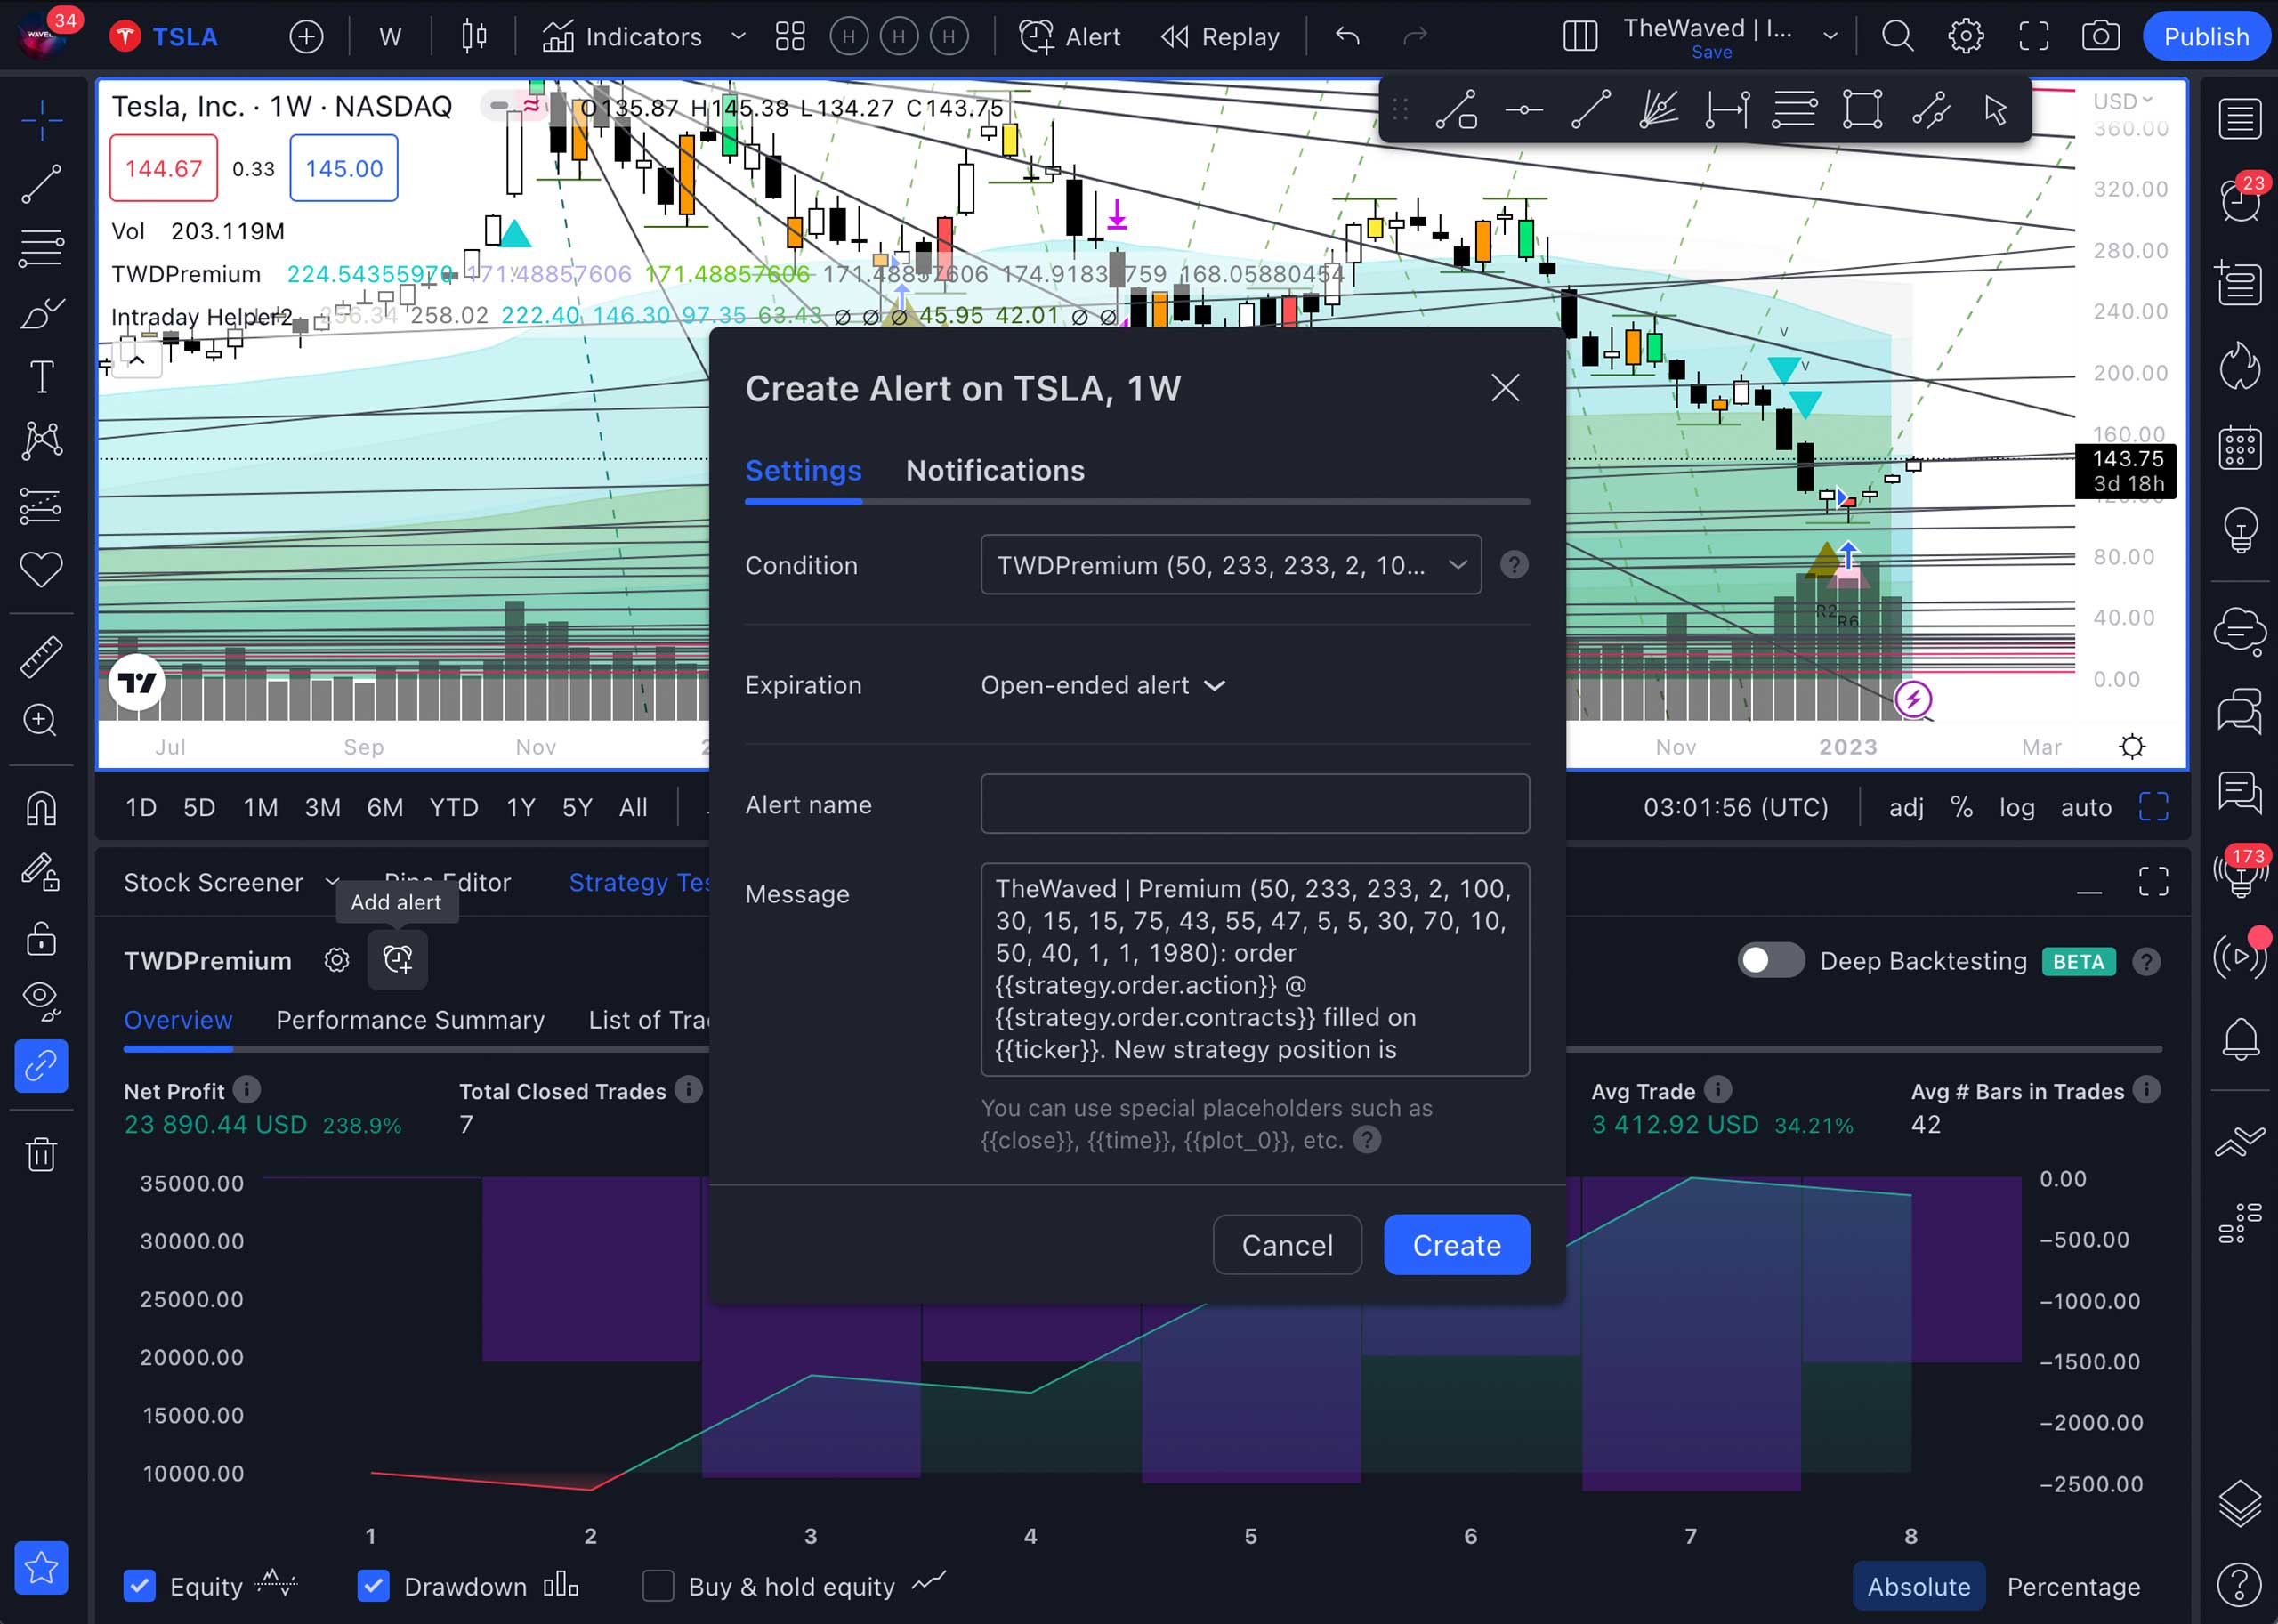
If you have already activated a trial or permanent paid subscription to Tradingview, you can configure signals on several timeframes. To do this, you need to open the menu that is located under the main chart. It can be found by left-clicking at the bottom of the screen and pulling up the arrow that appears. Select the Strategy Tester section. Then click the Add alert button, shown as an alarm clock with a “+” sign.
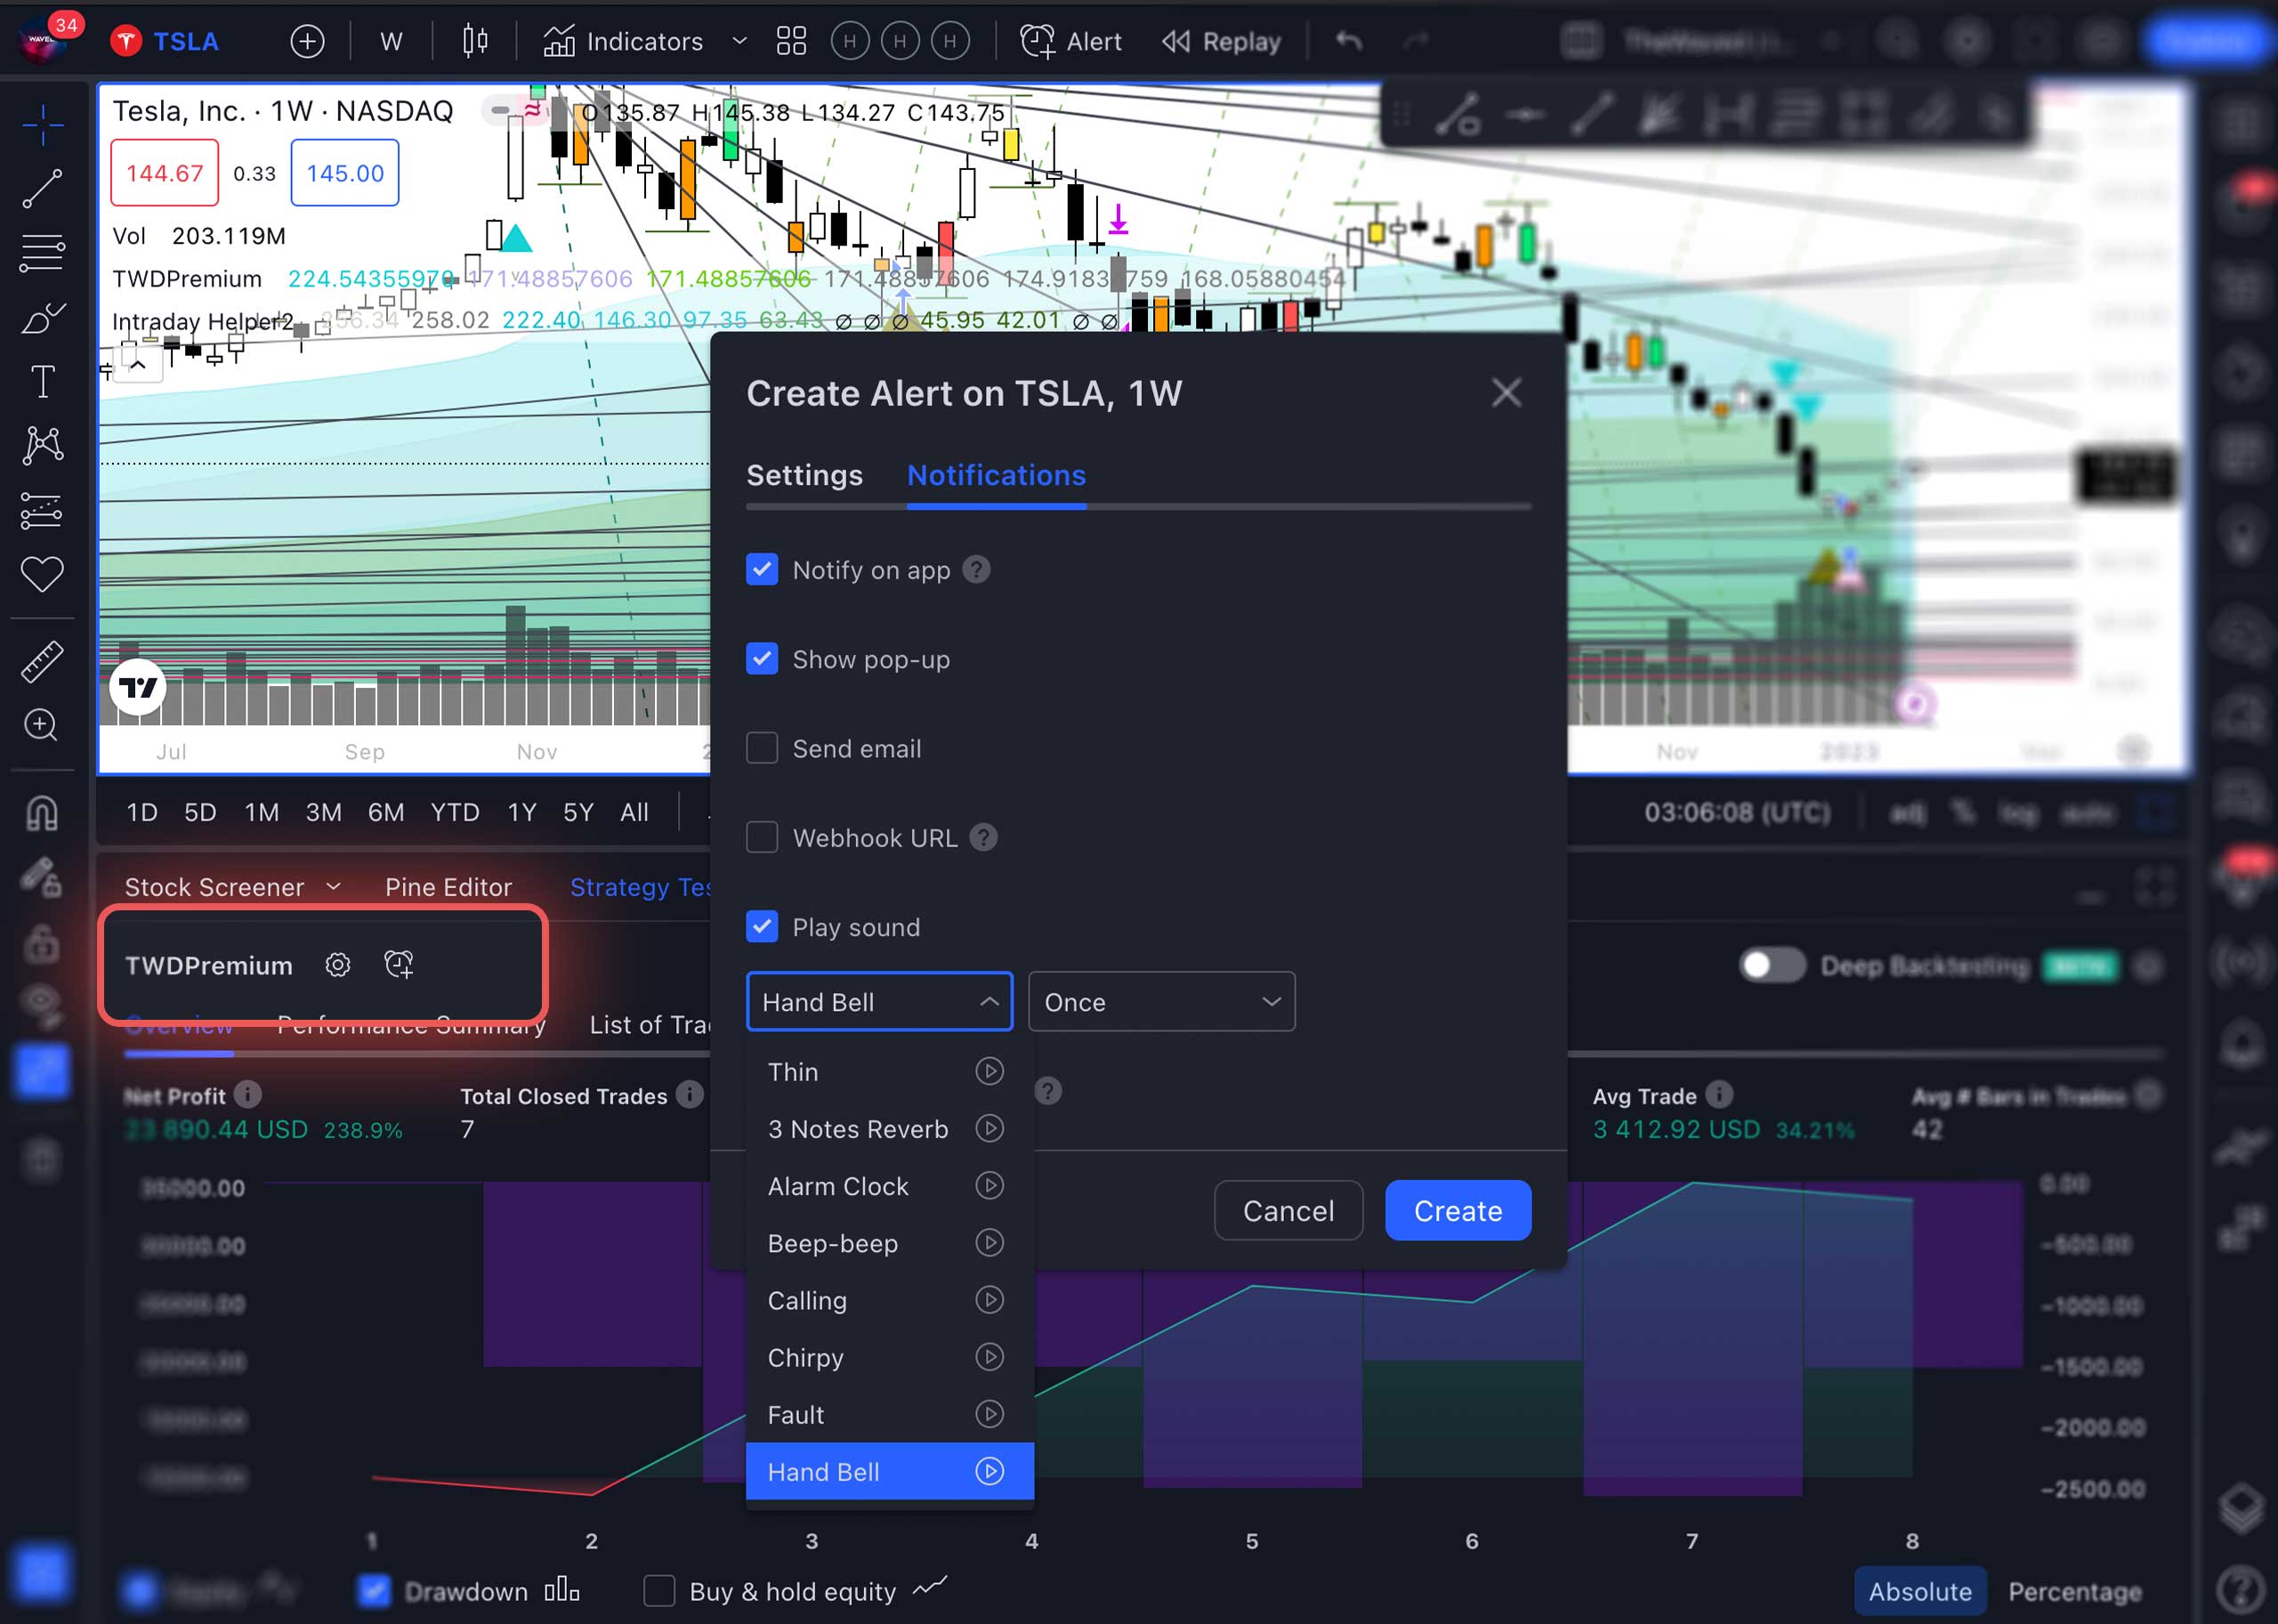
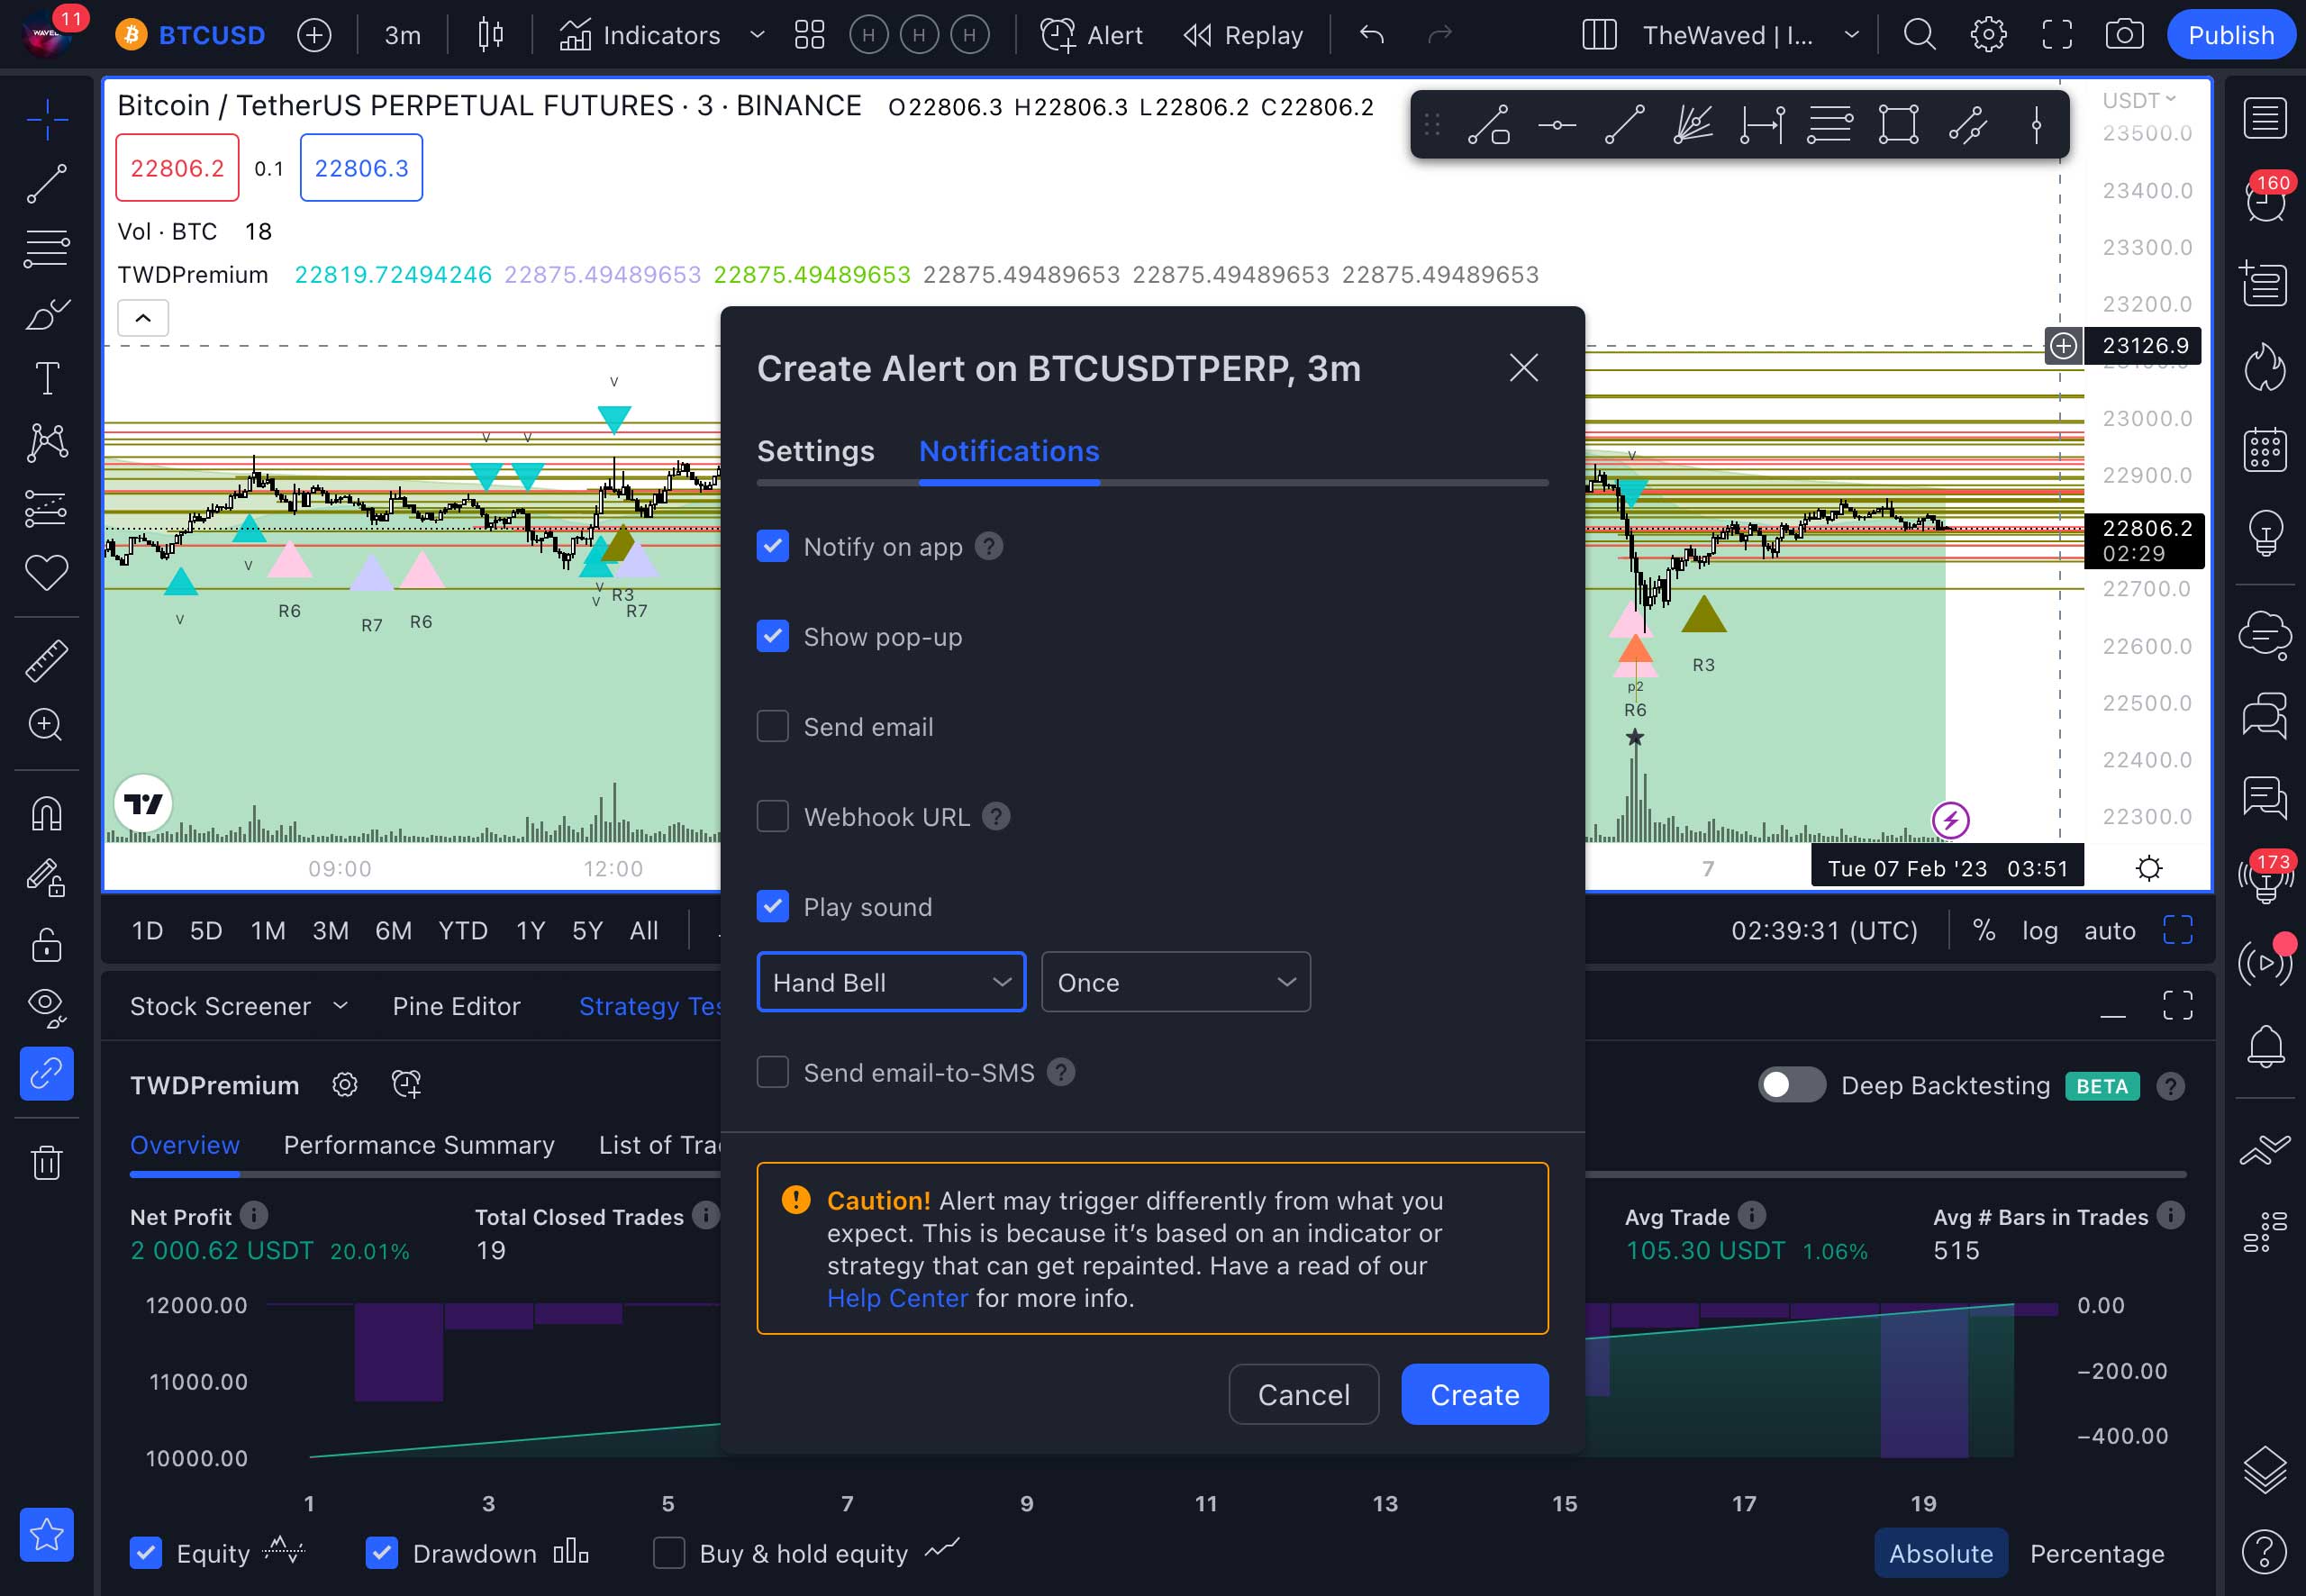
In the pop-up window in the Notifications section, you can select the way for receiving signal alerts. For example, in the app or email. You can also choose the sound and duration of the signal.
In the Settings section, you should give a name to the signal (1), select its duration (3), and write a message (2). Without subscribing to Tradingview, you can set up only one alert per signal. Therefore, for profitable work, we recommend that you immediately sign up for a trial paid subscription.
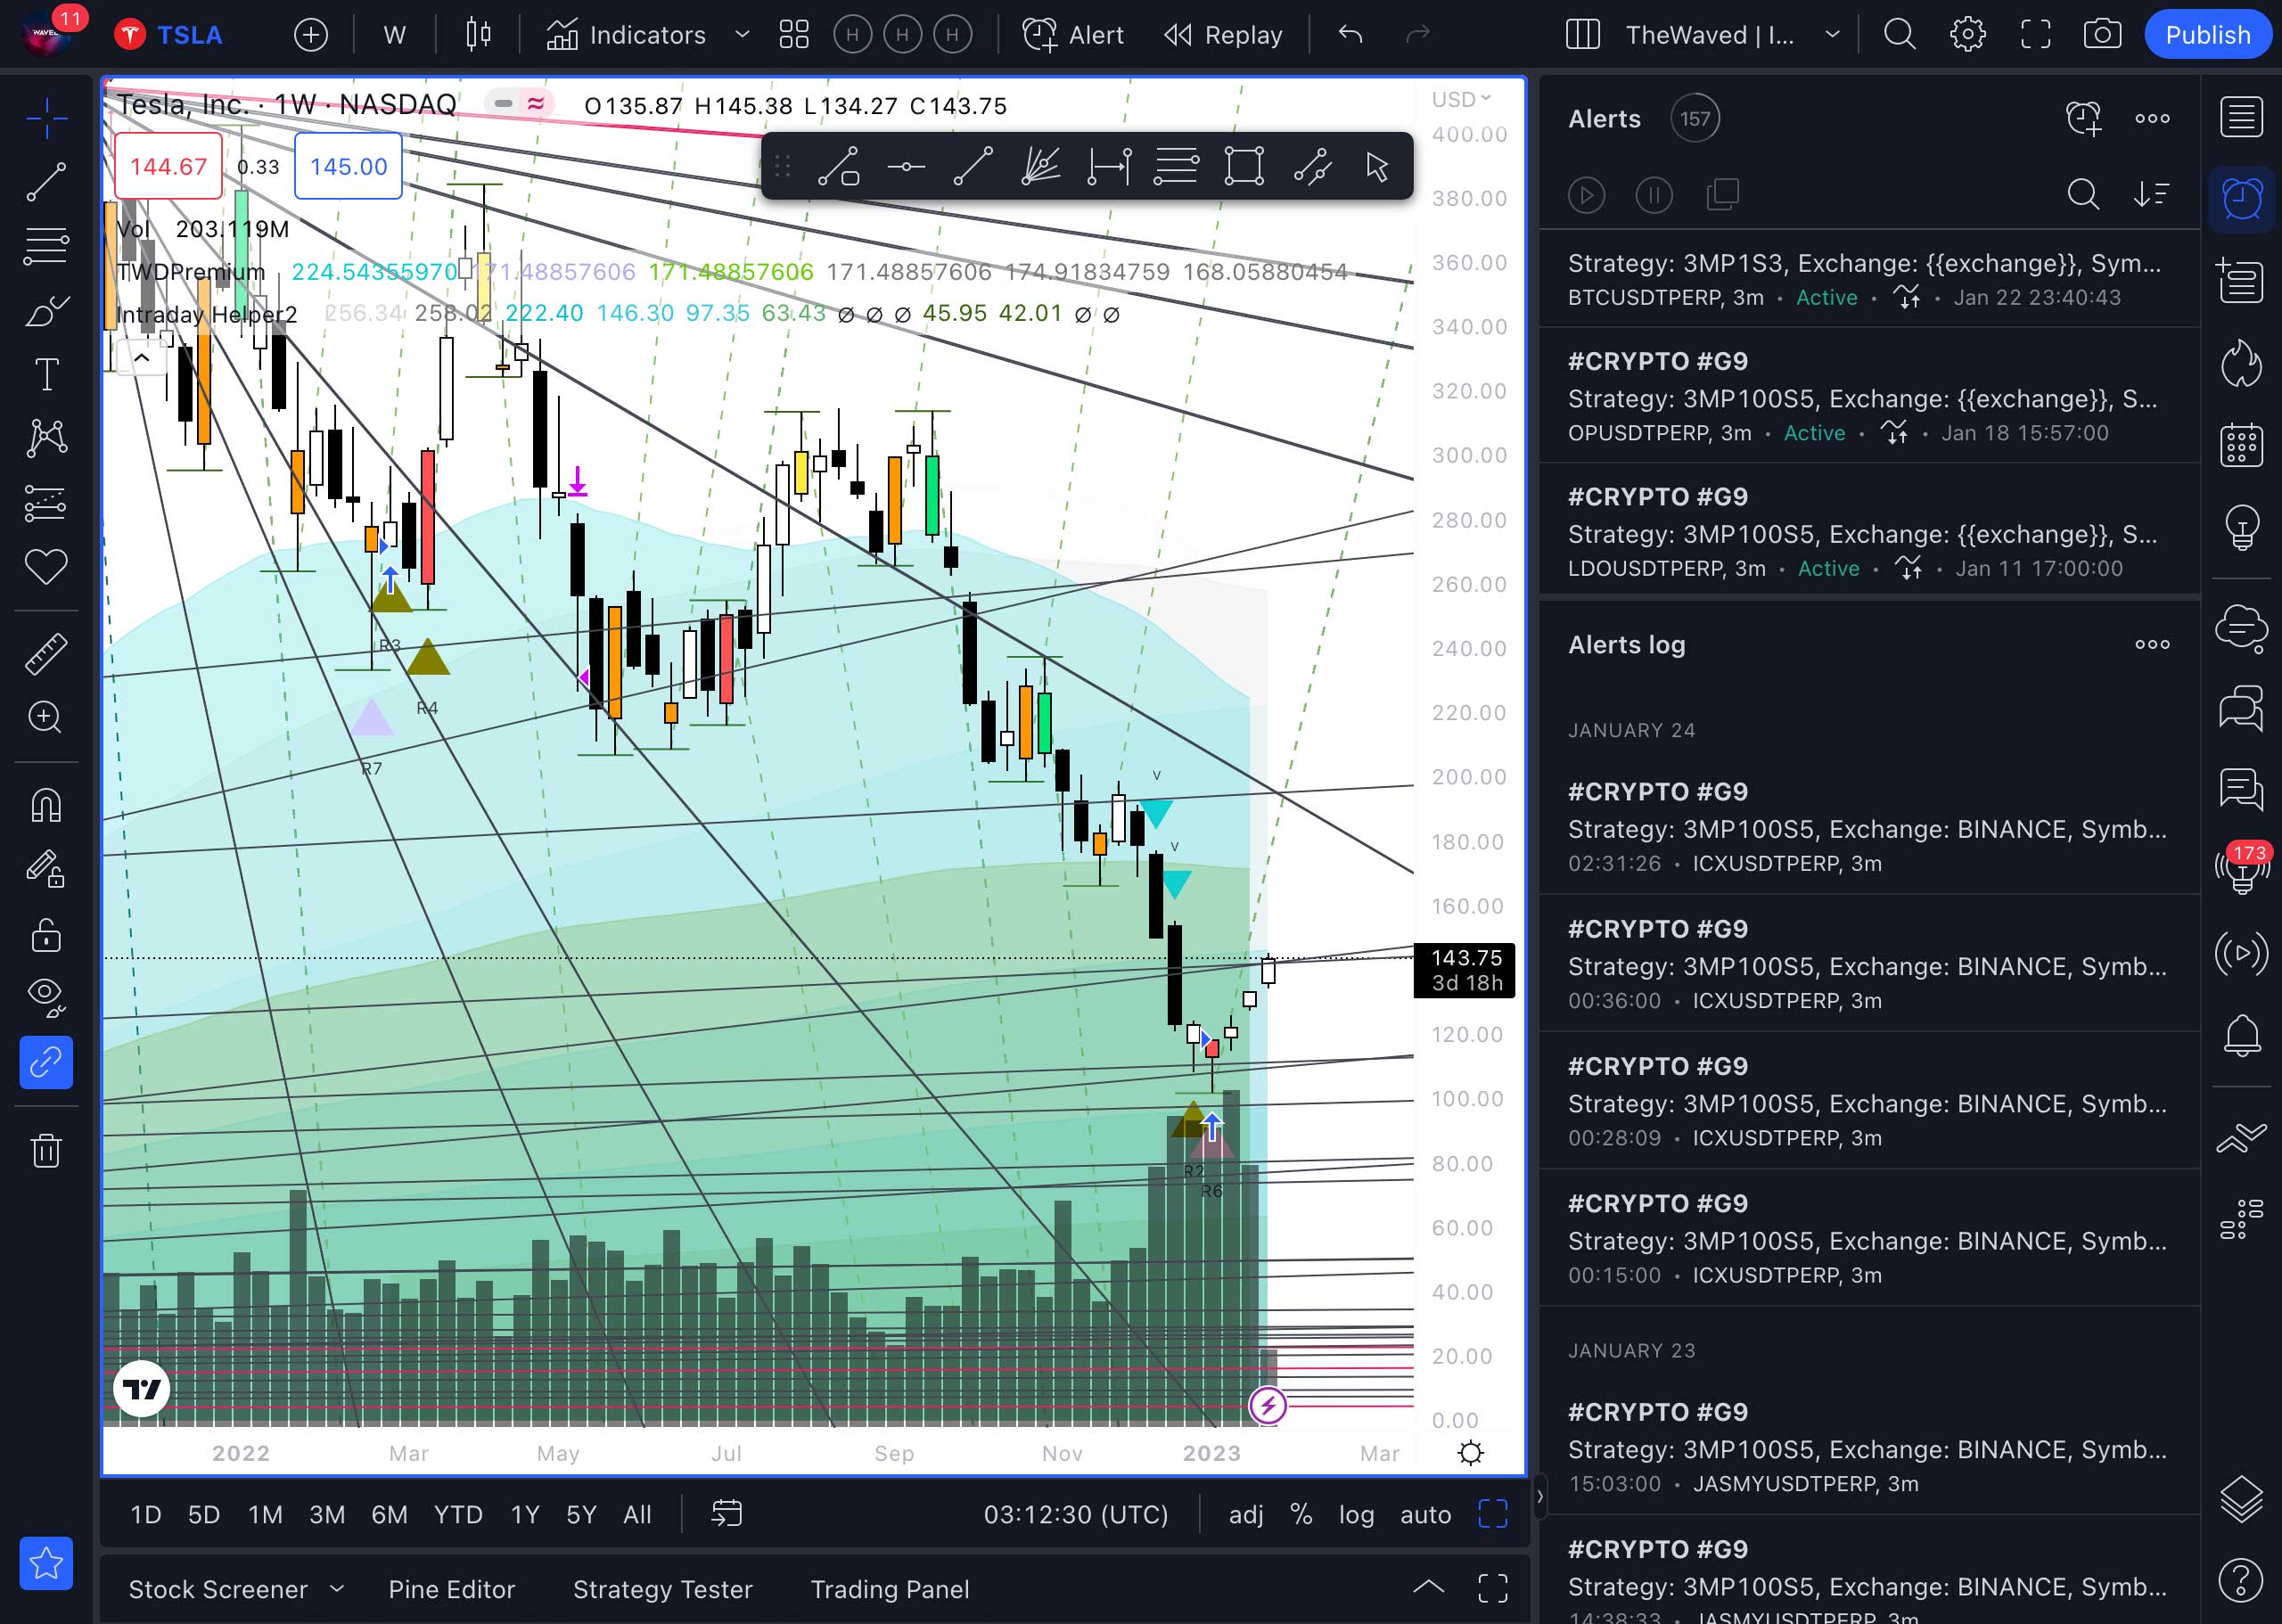
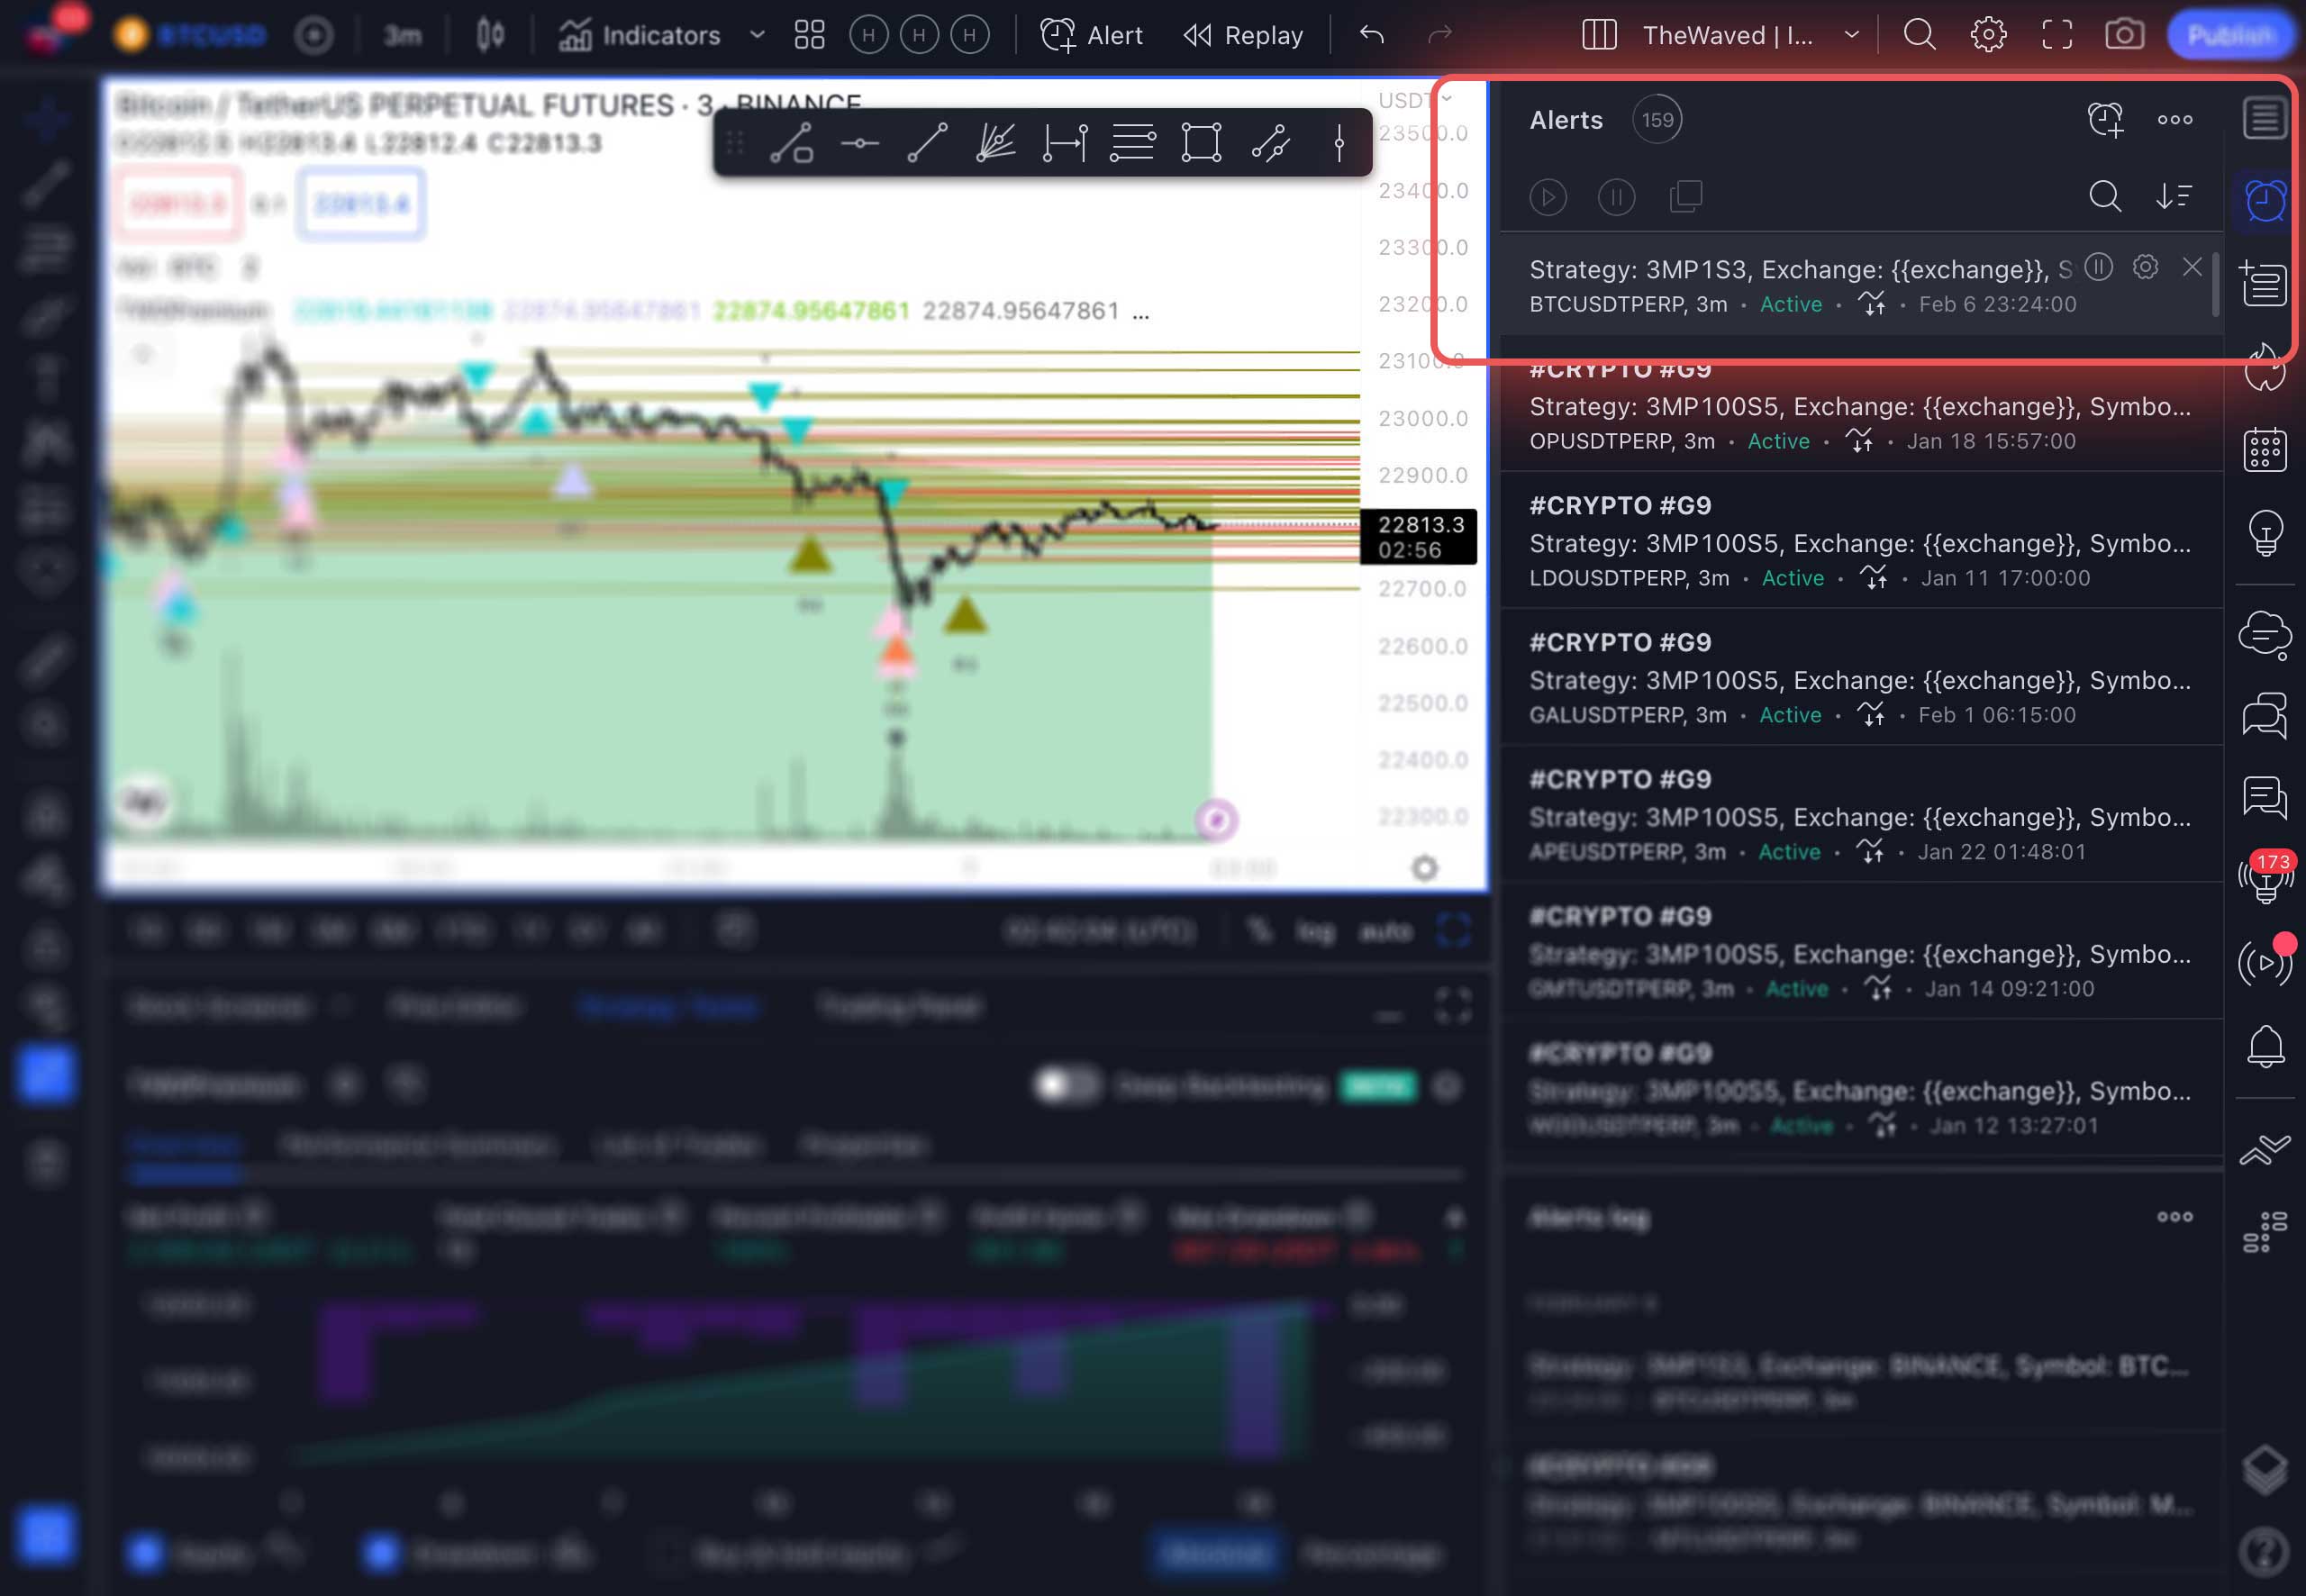
You can view your signals in the Alerts section.
Changing the chart style
Tradingview has two color schemes for displaying the chart. Standard Light and Dark mode, with a black background. For your convenience, you can change the colors of the chart so that nothing distracts you from the indicator signals. Since when it is applied, many metrics and signals of different colors will appear.
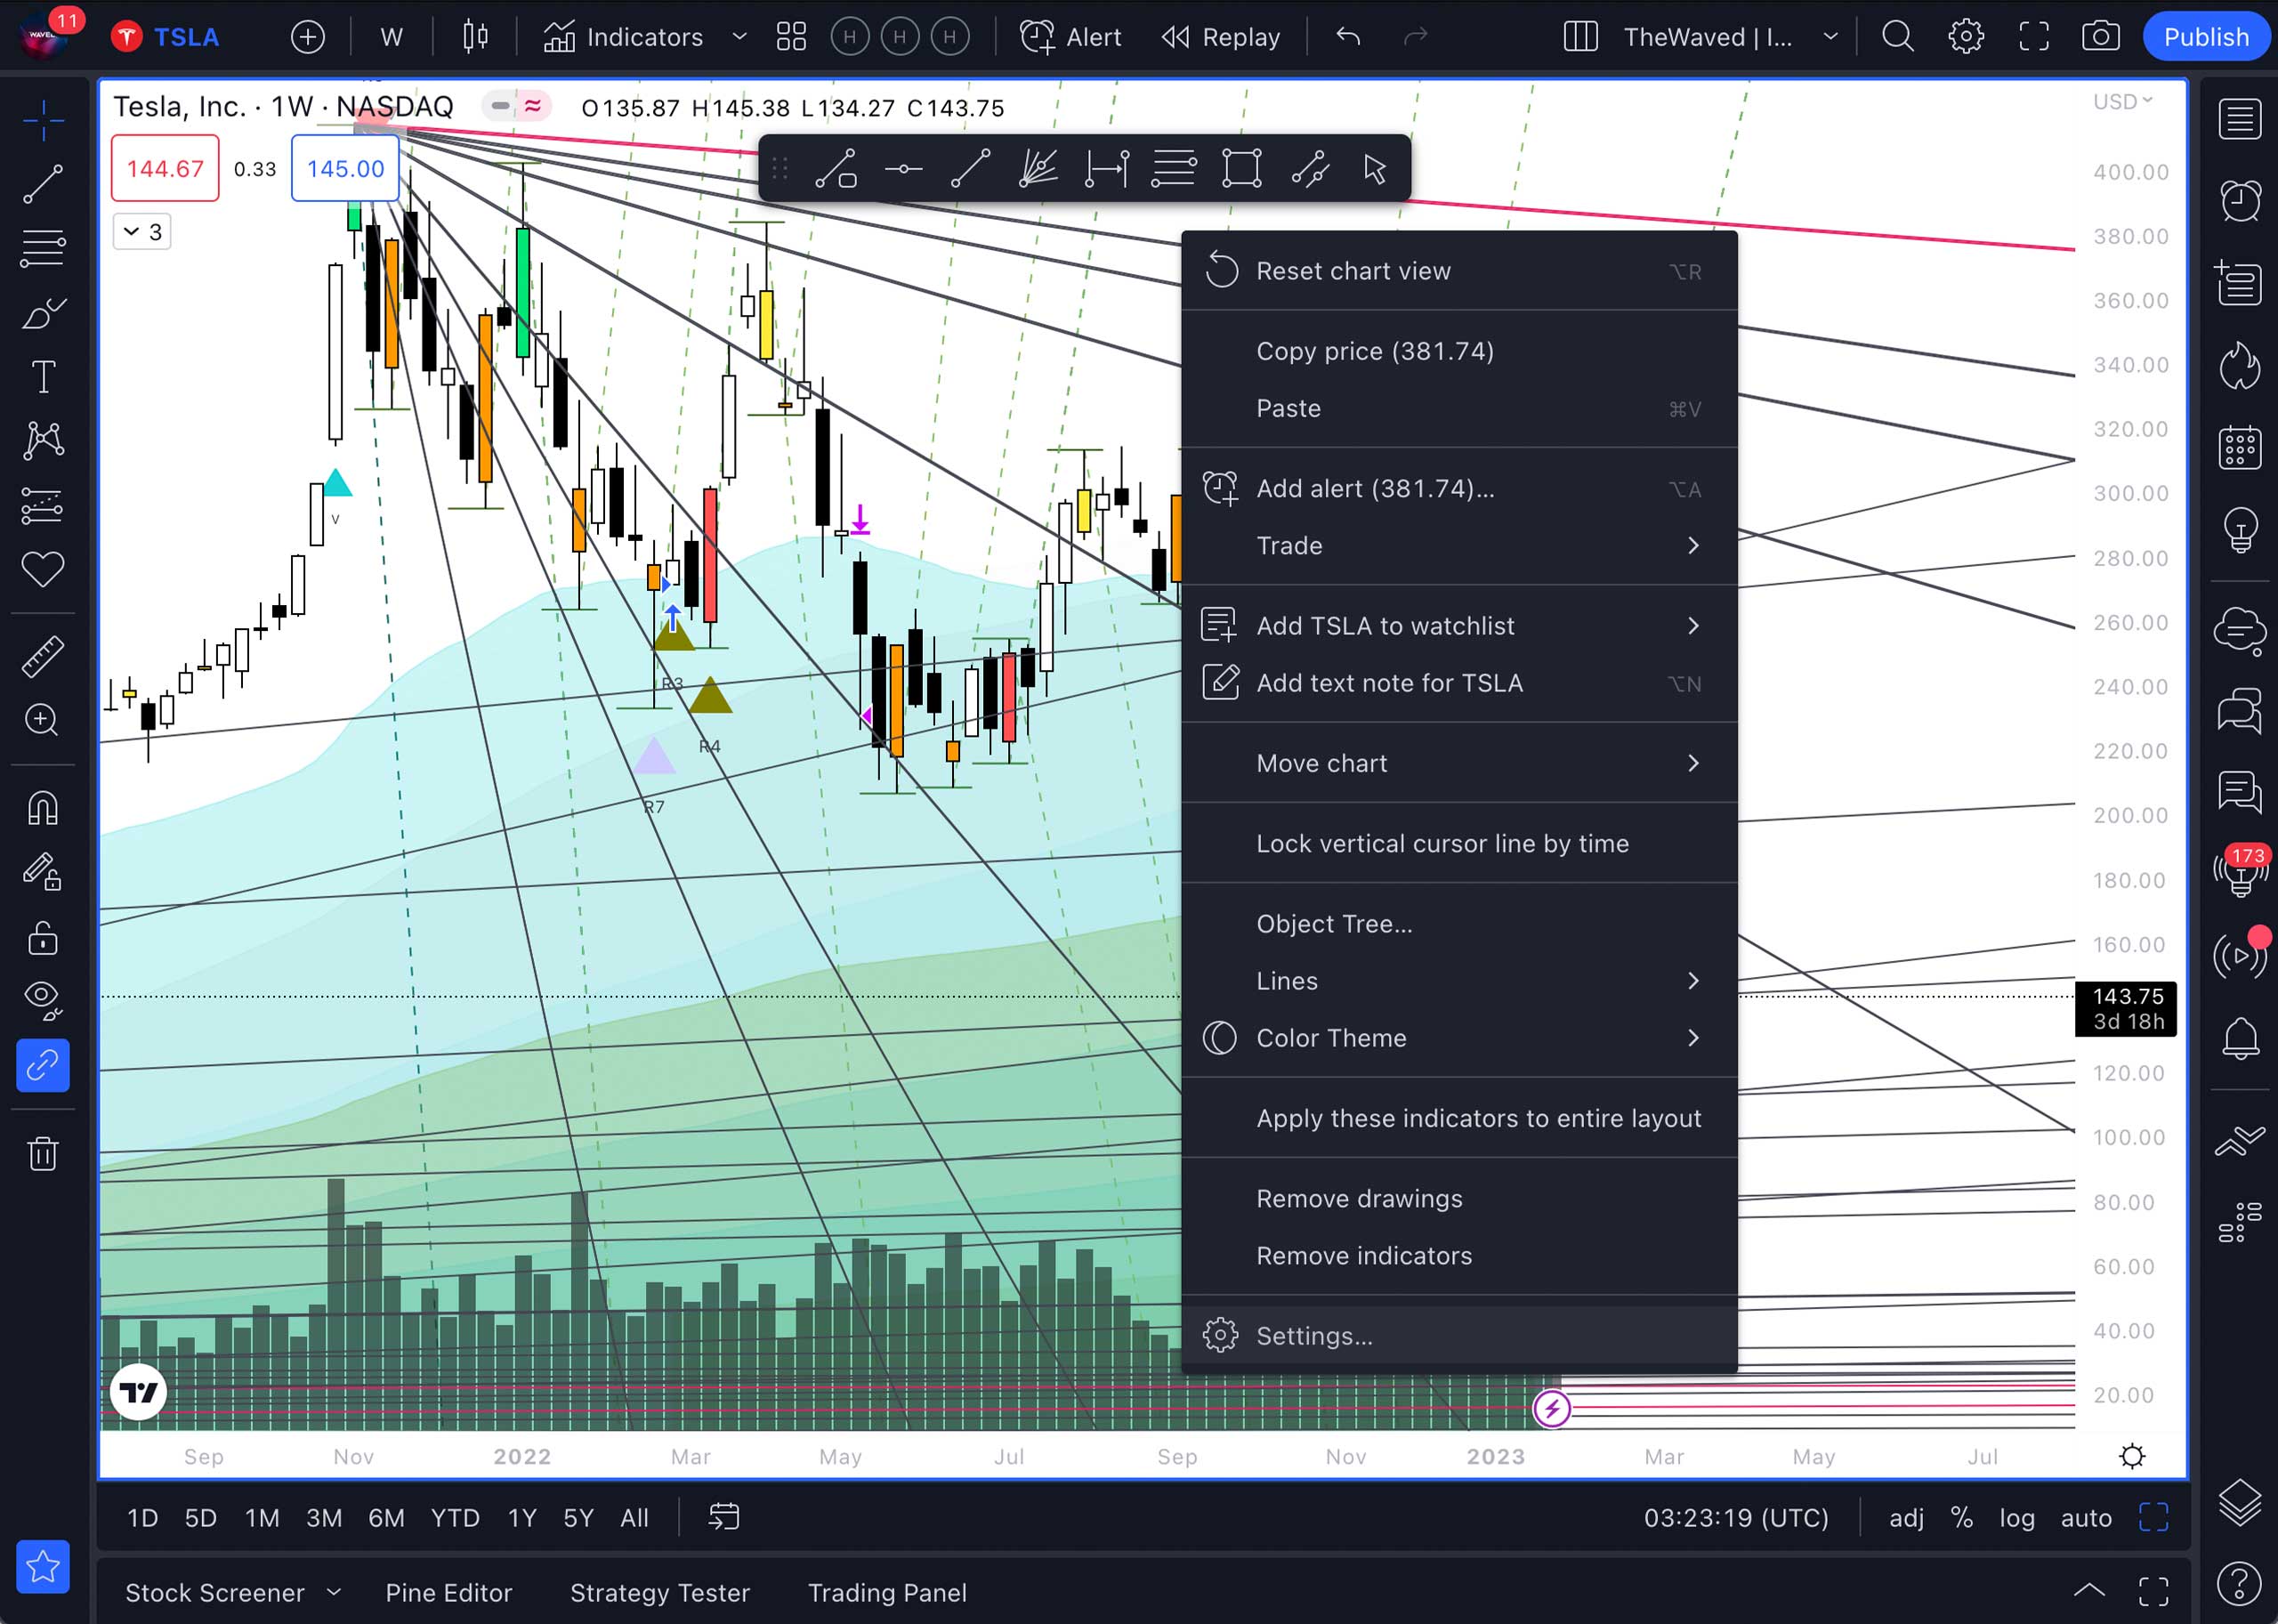
To change the colors of the bars, you need to “shift” the chart by holding down the left mouse button and right-clicking on an empty area. A pop-up window will appear where you will need to select the Settings section
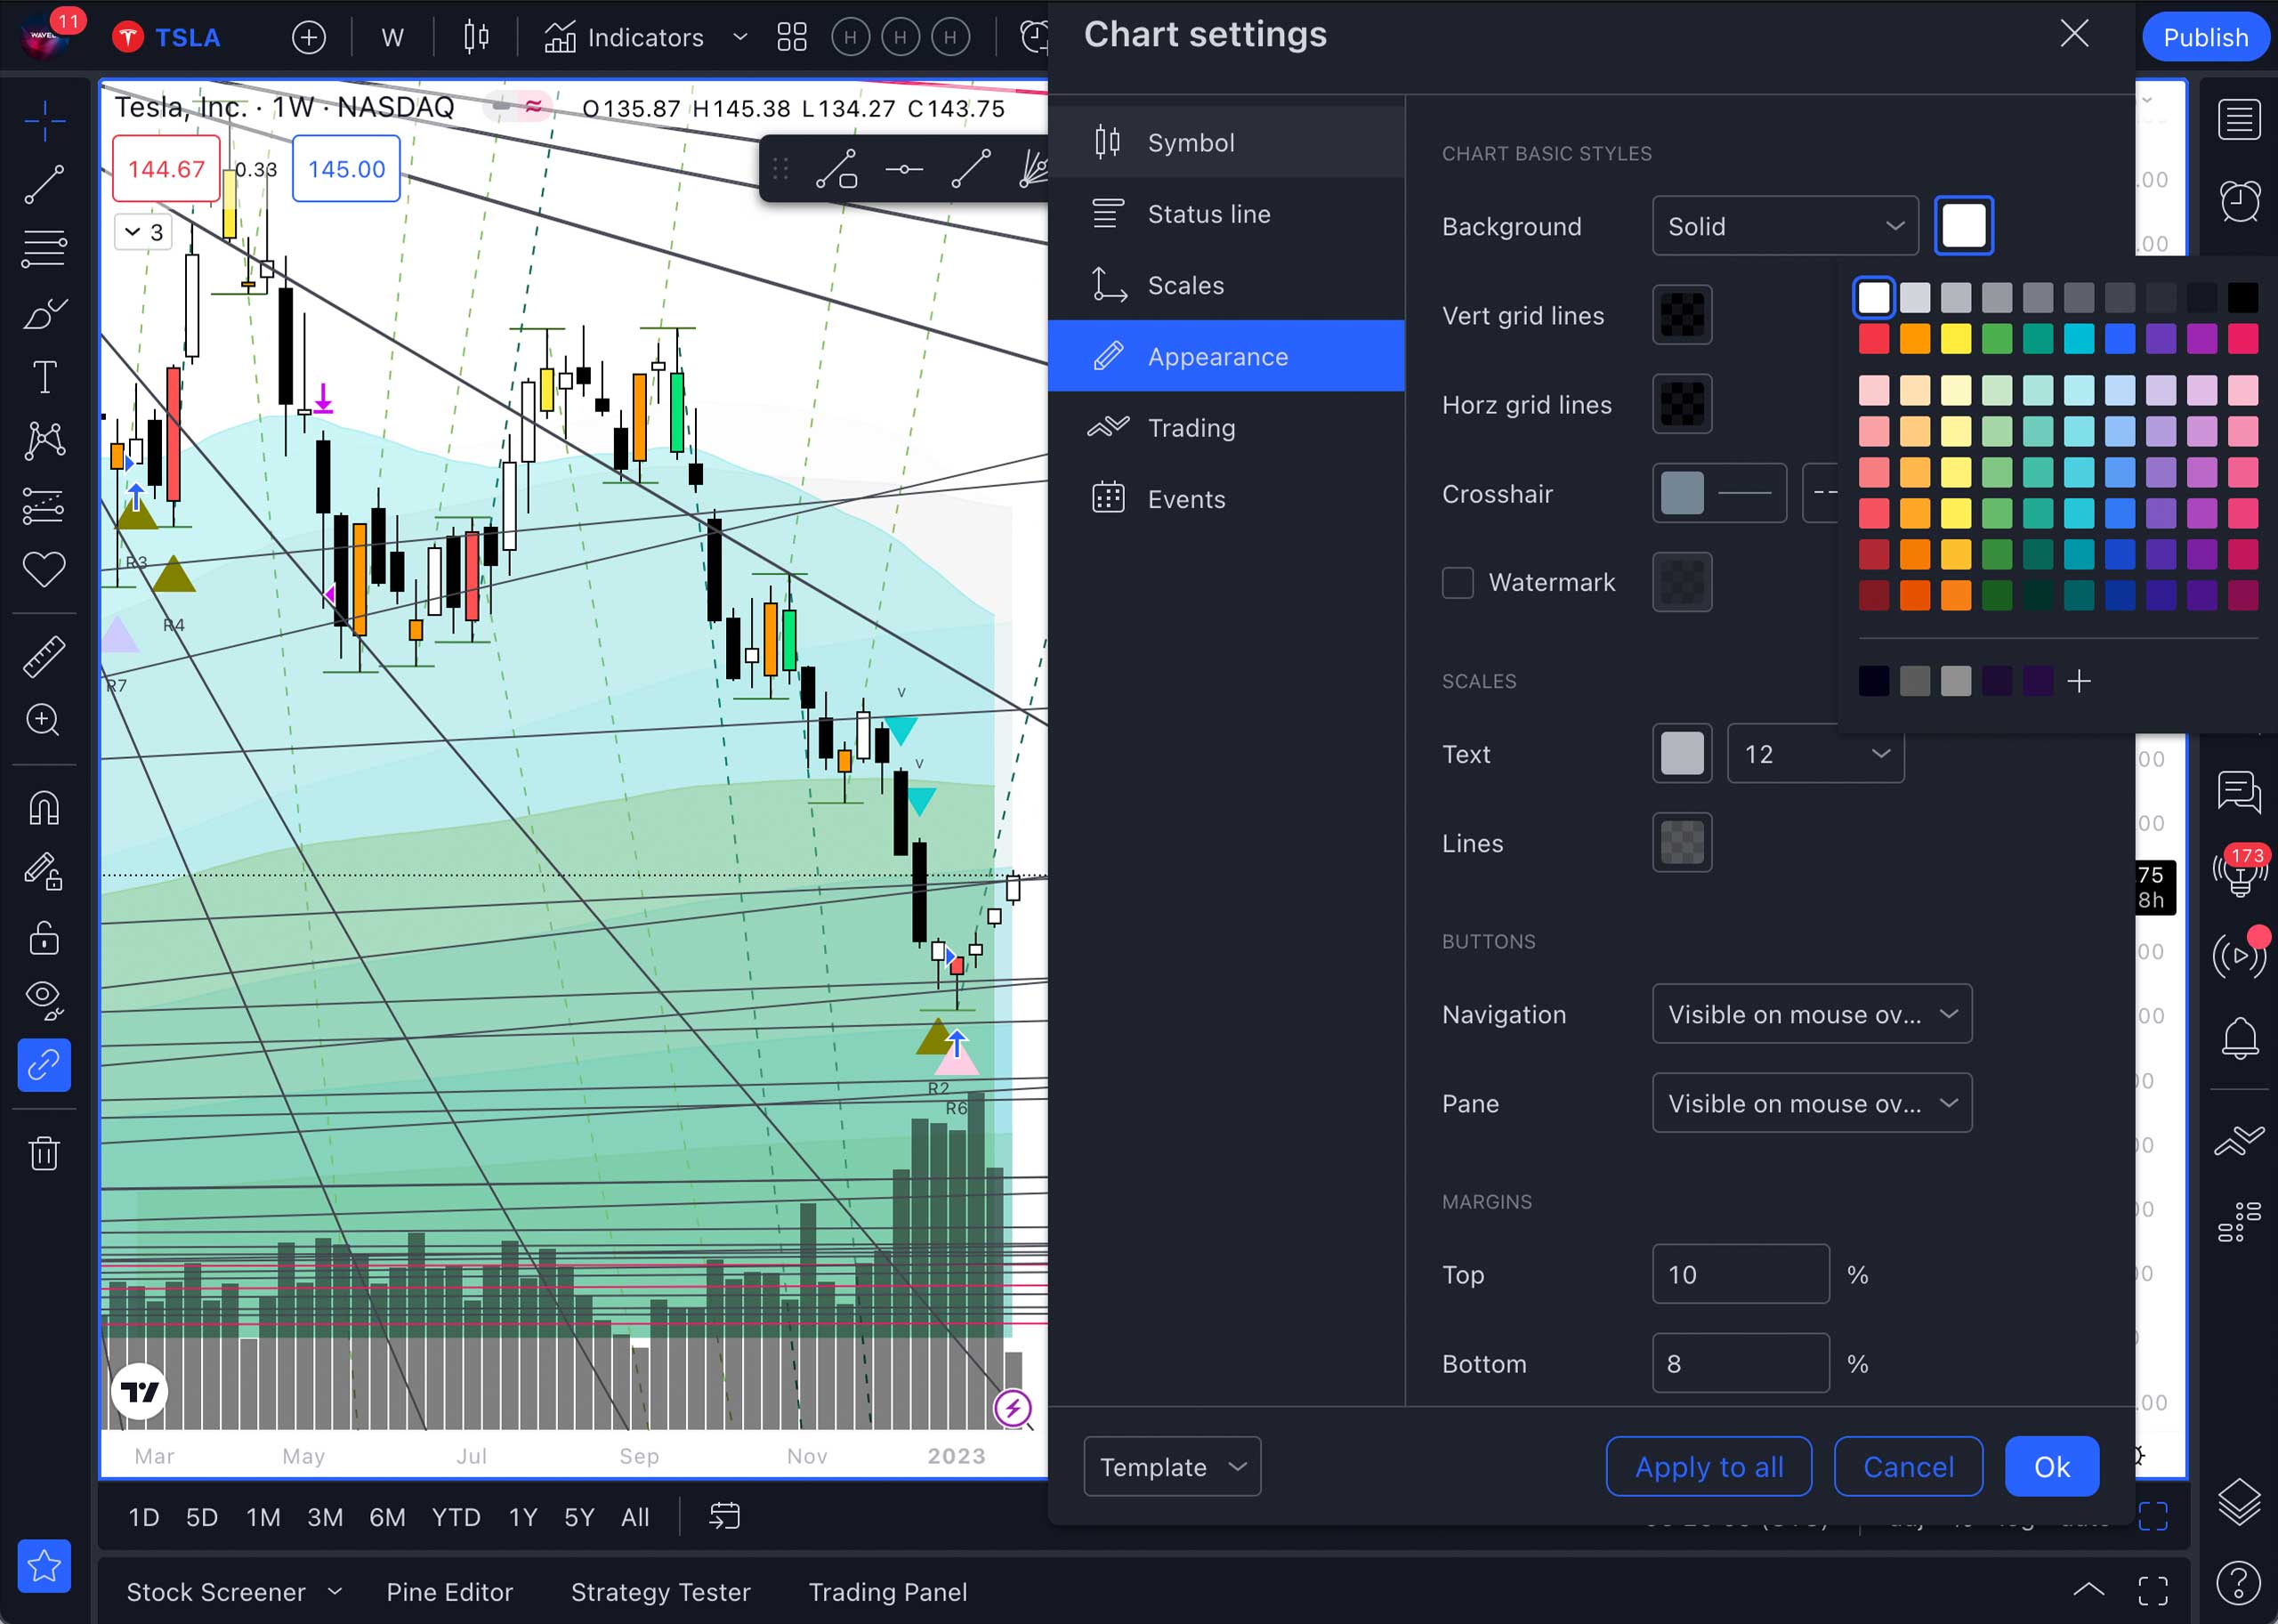
In the Appearance section, you can change the background and font colors.
To change the background color, go to the Appearance section of the Chart Settings. Here, in the Background window, you need to select Gradient. You can choose any color or shade of gray you like. The trick is that the bars will look voluminous on such a background.
Thus, if you want to switch to the dark theme, the user settings will be reset.
With the dark theme, you can use other shades of the main colors of the bars. For example, instead of red – pink, and instead of green – light green or turquoise.
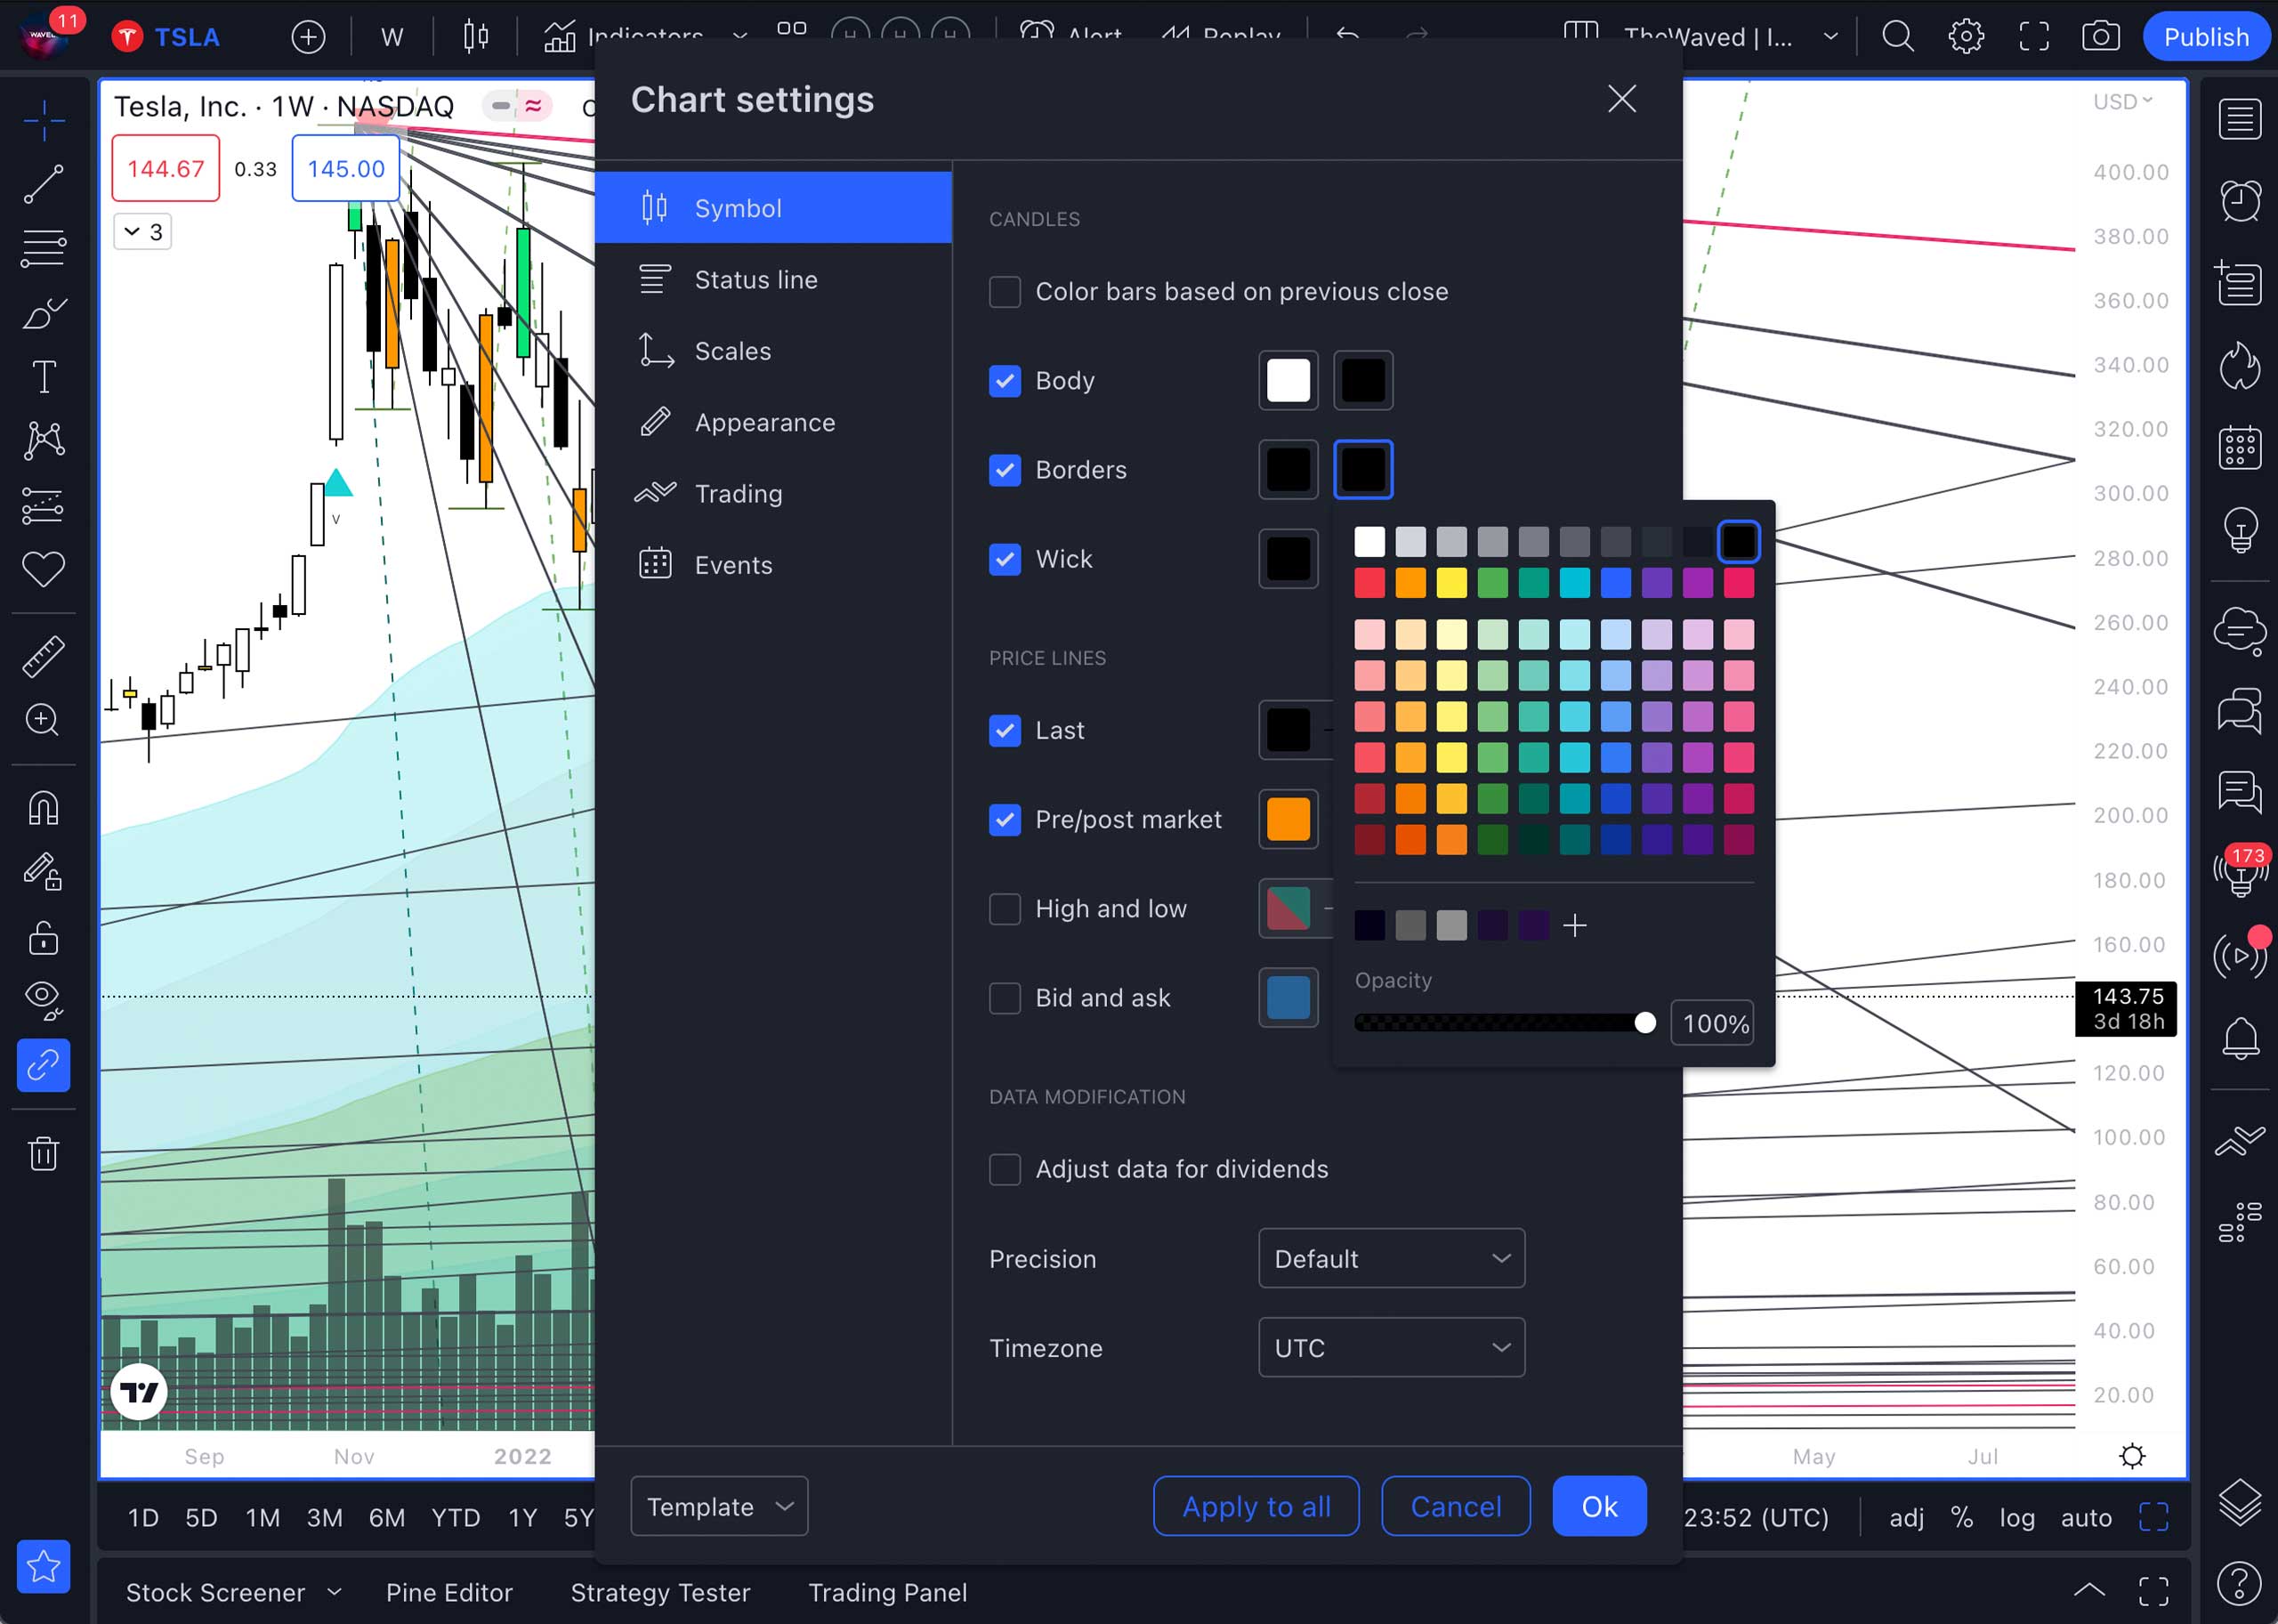
In the Symbol section, you can change the color of the bar, for example, to black and white. Change the body color of the green candlesticks to white, and the red ones to black. The color of the candlestick contours and wicks should be black in this case.
In the Status Line section, you can remove unnecessary blocks of information from the screen.
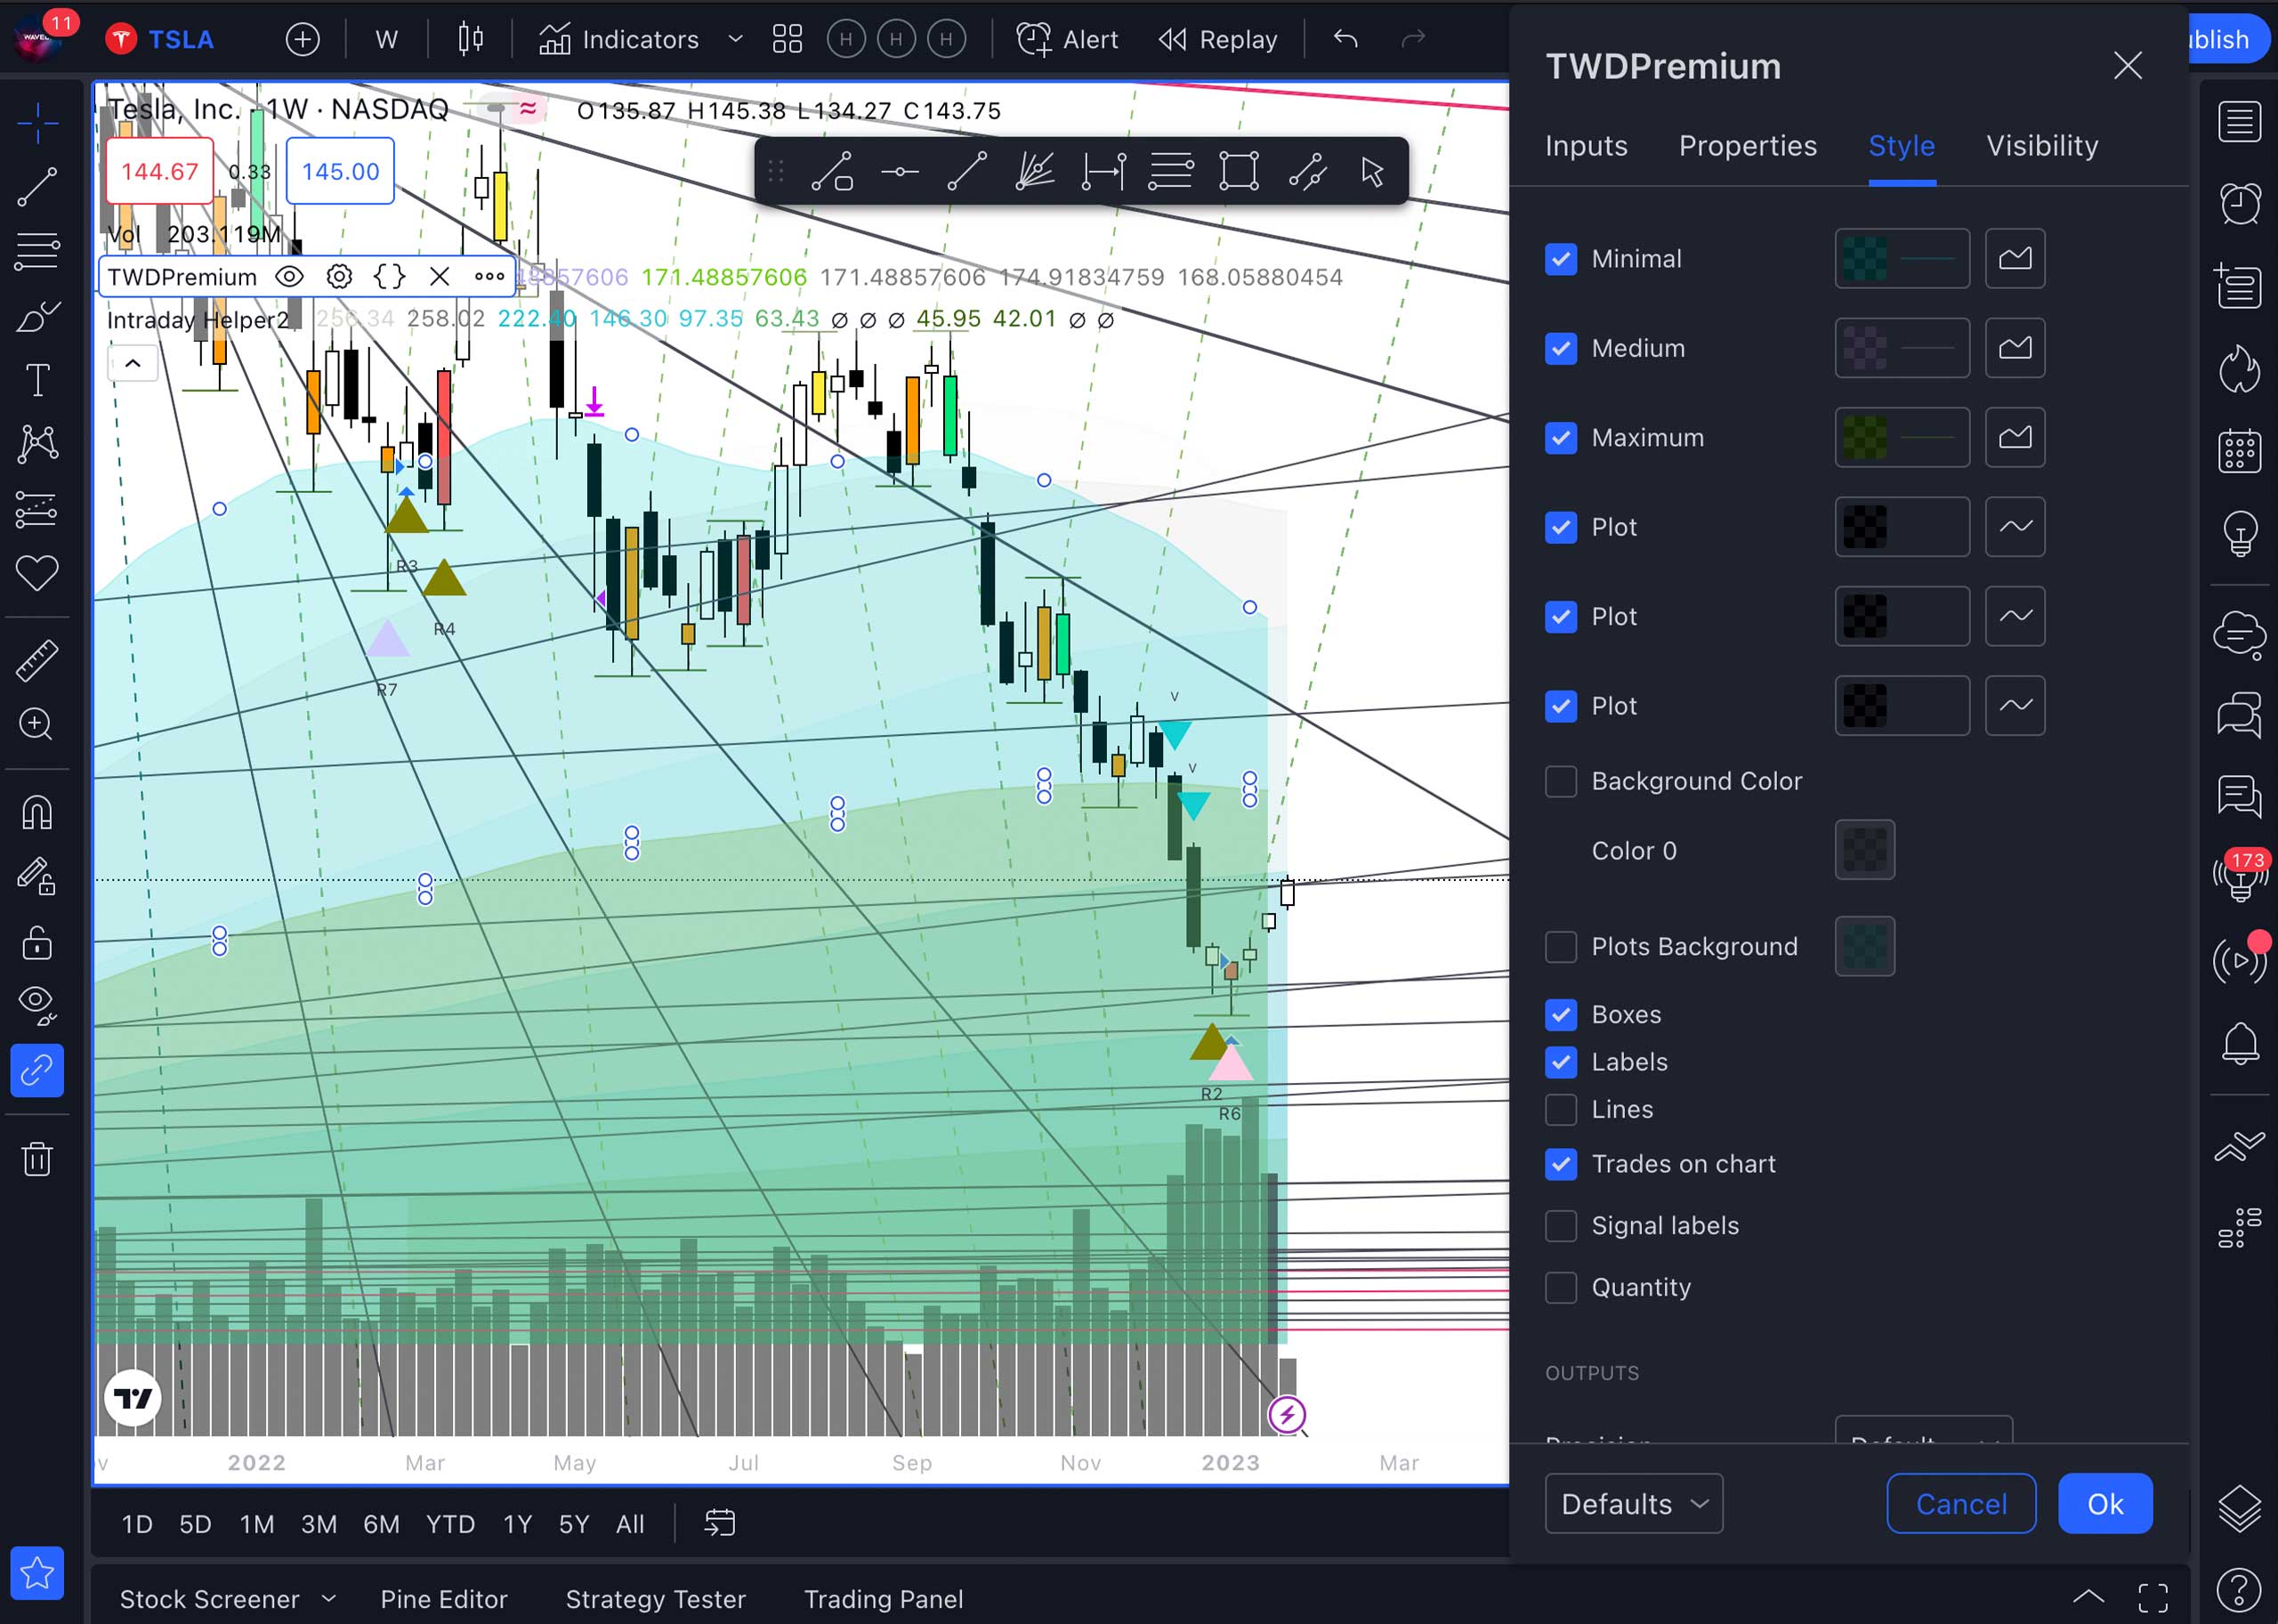
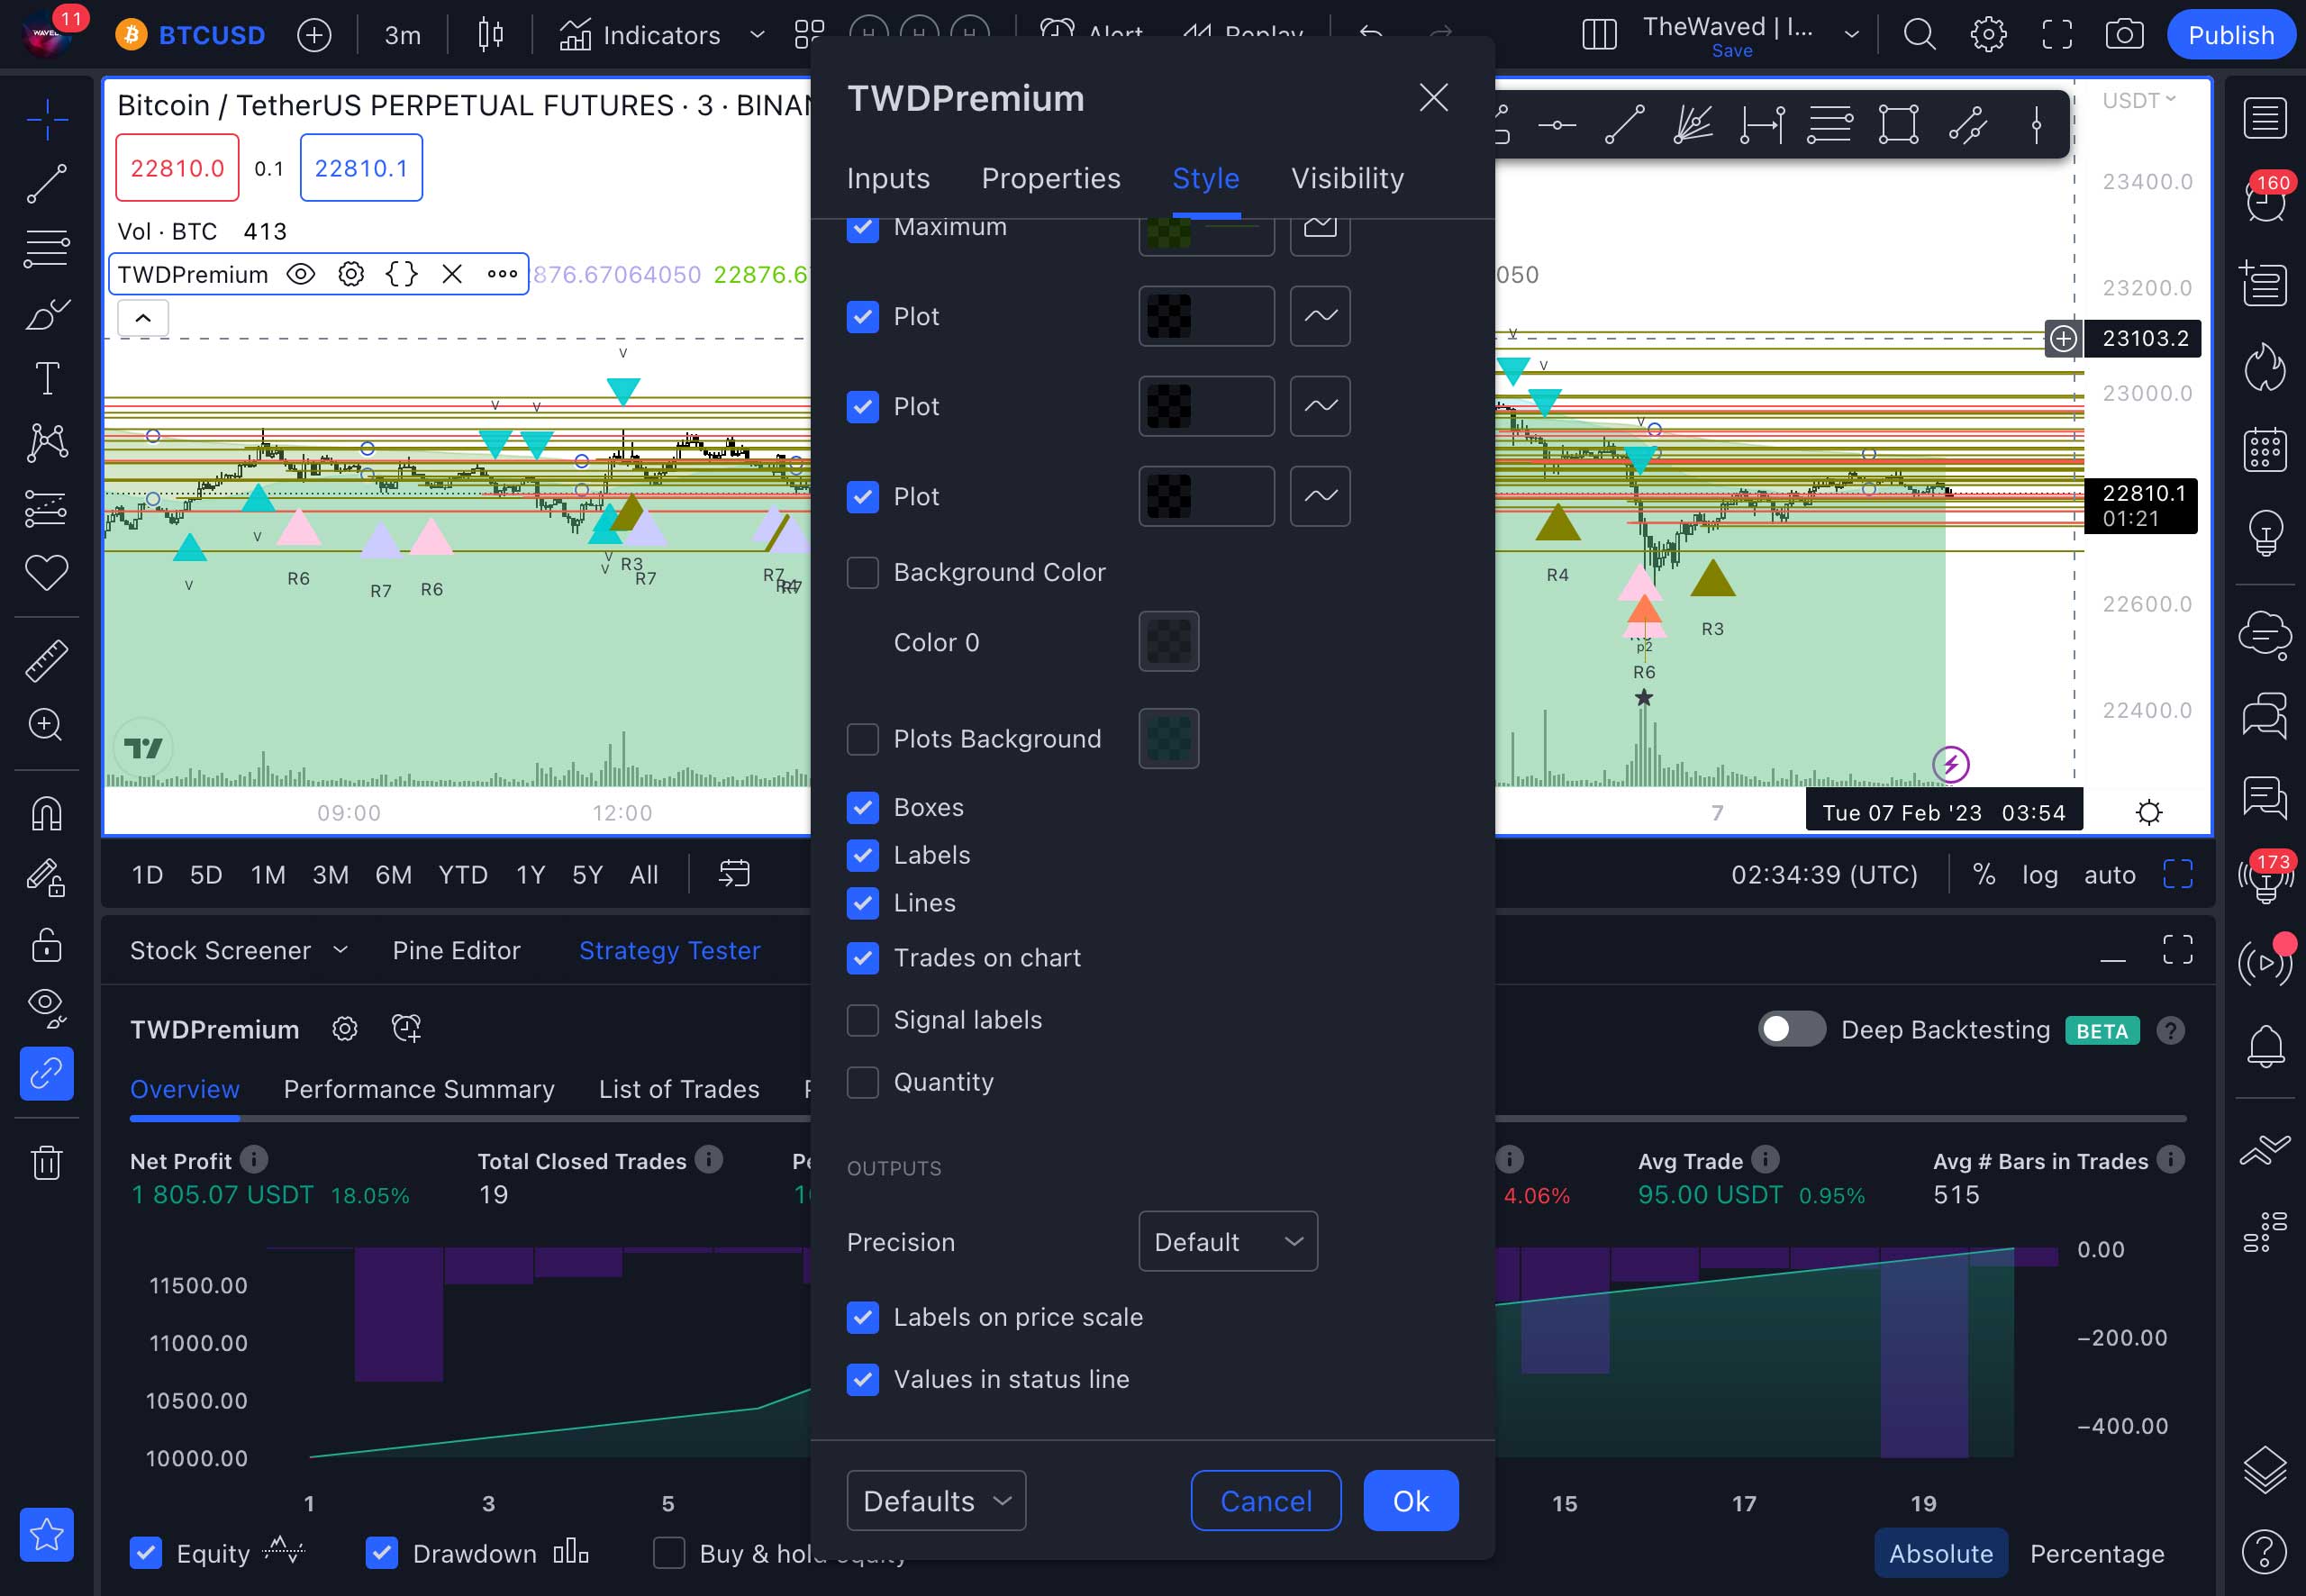
To adjust the appearance of signals on the chart, go to the indicator settings section. Here, you can use the checkboxes to enable or disable signal descriptions. In the Style section, you can change the colors of the trading volume charts to different shades of gray and make them transparent by 20%, so that they harmoniously match in colors when the background color changes.
Paper Trading training and test trading
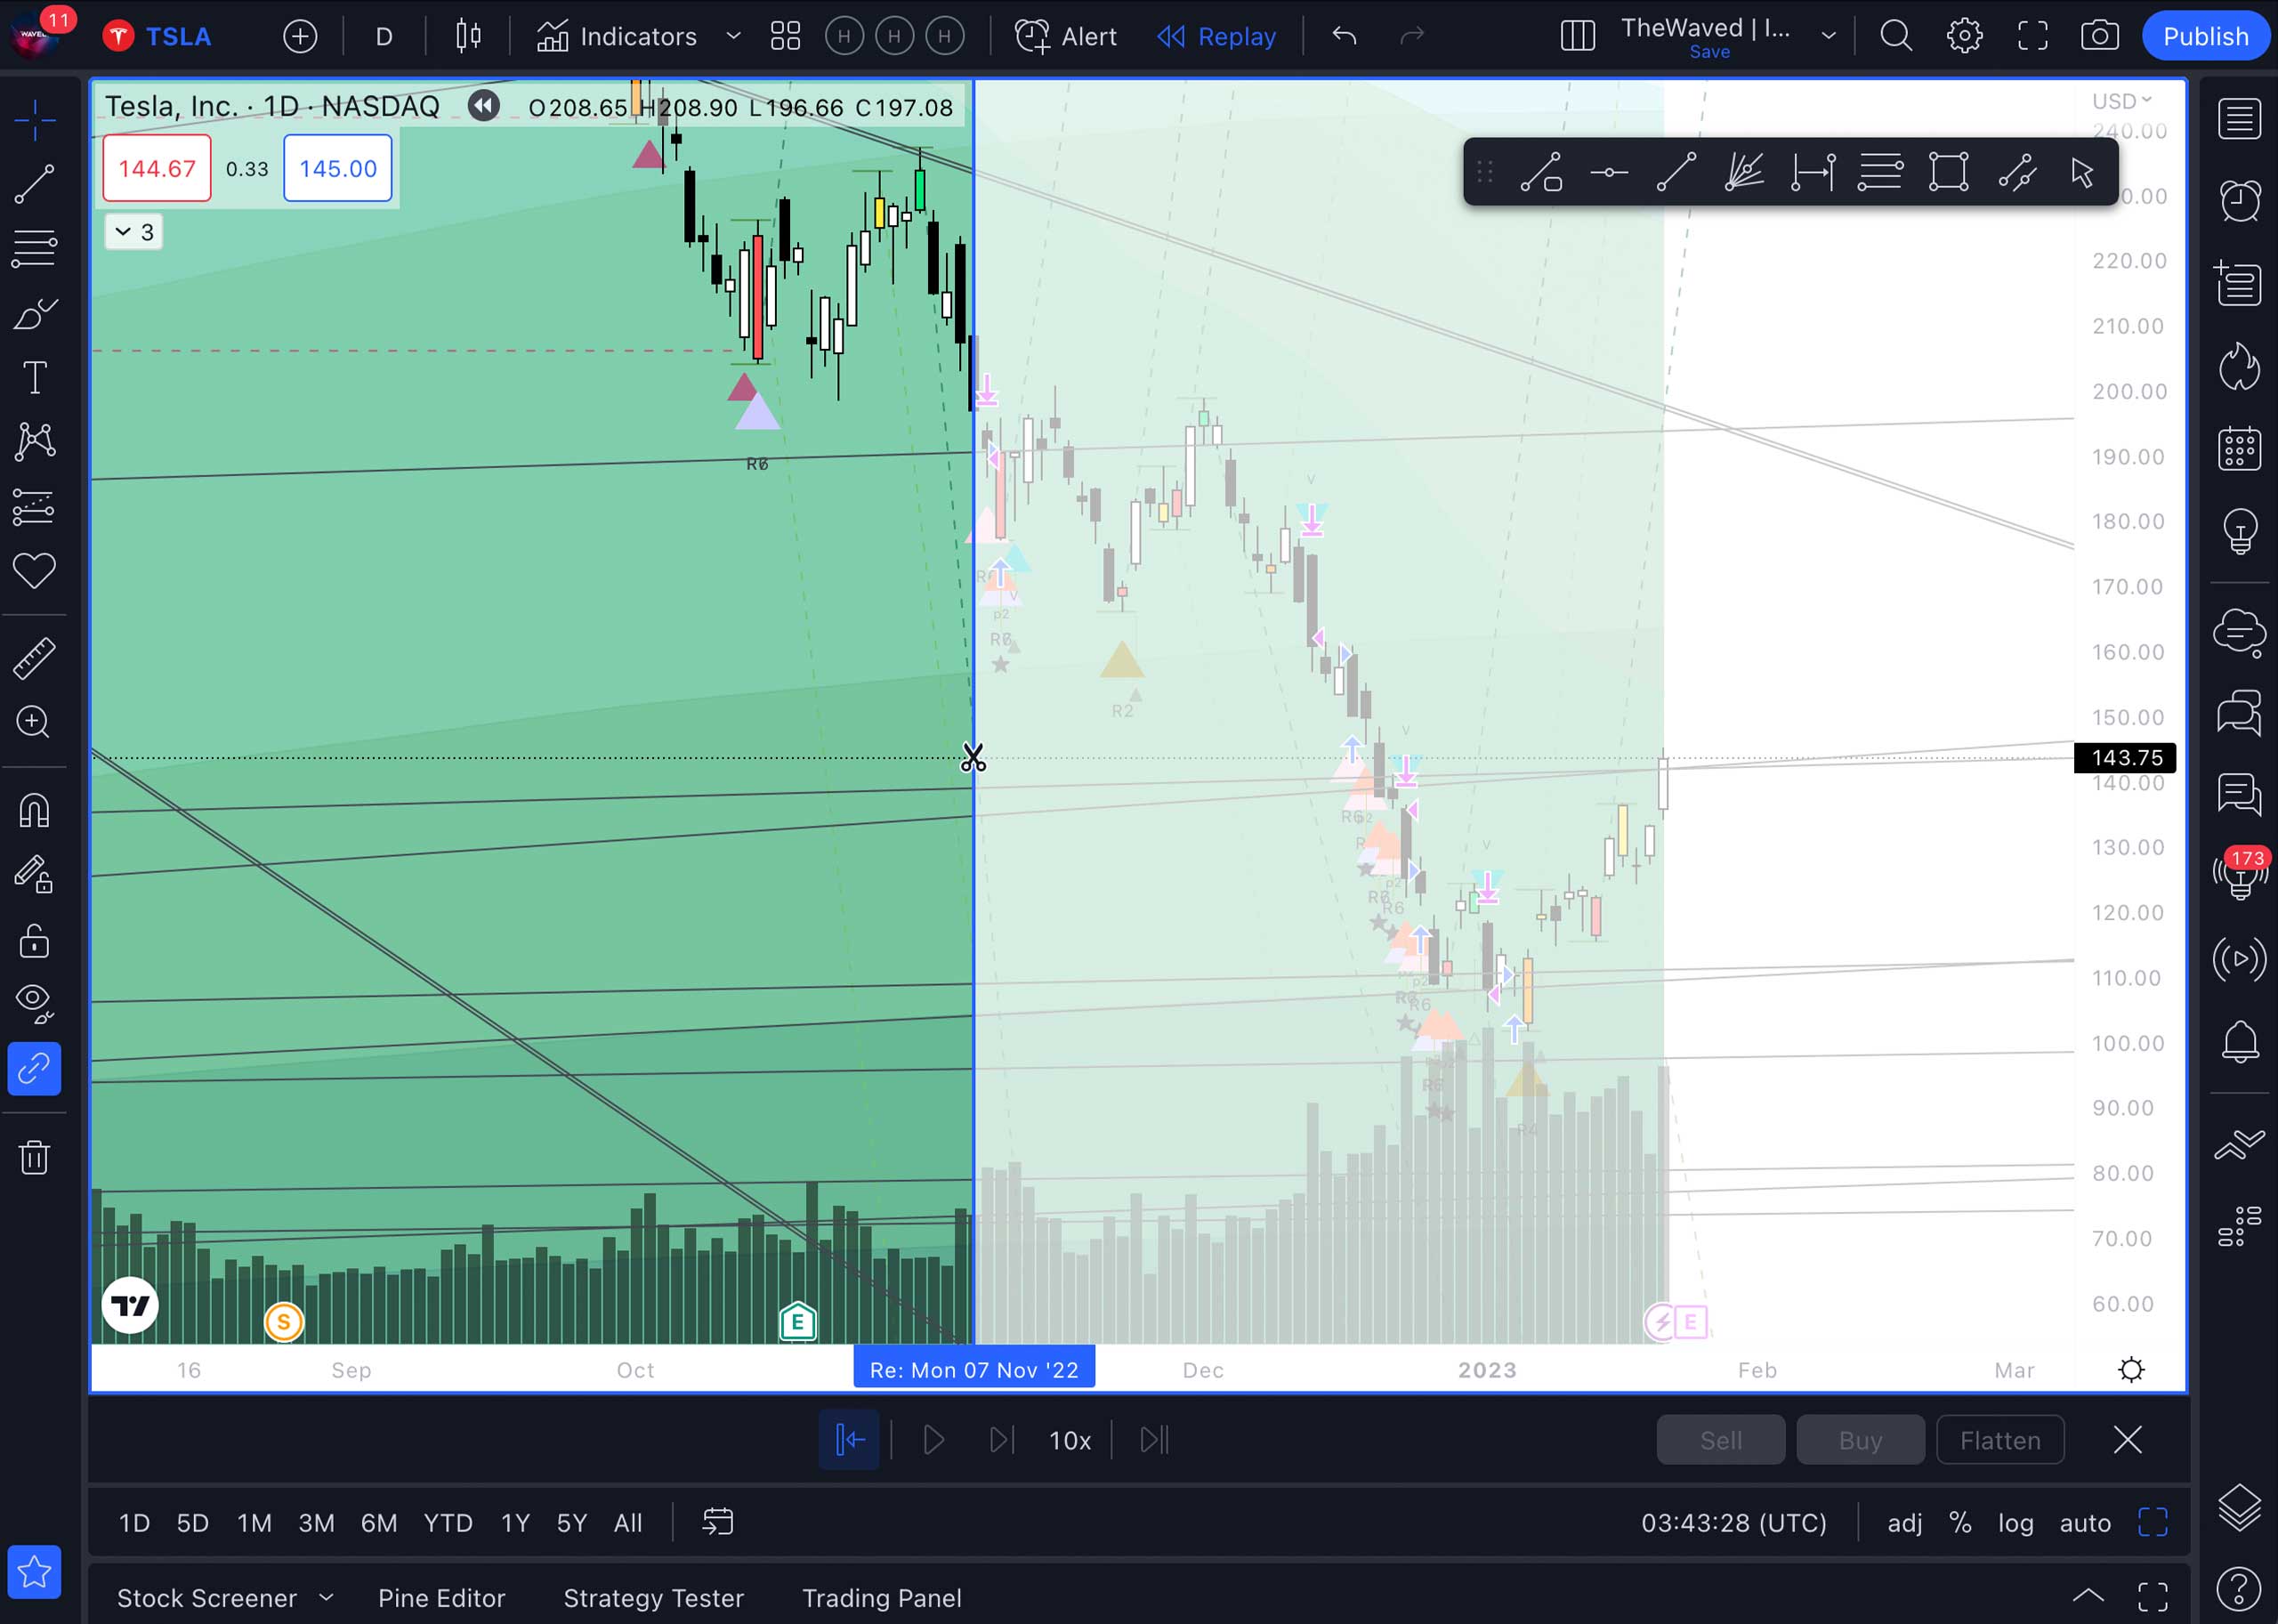
To learn how to work with signals, you can practice trading on historical data. To do this, select the Replay function in the instrument settings and “rewind” to the time period you need. Then click the Play button and see how the strategy works.
If you rewind quite far, you won’t know what happened next. Therefore, you should see how the signals work. You can mark the places on the chart where you would have opened a trade and where you would have closed it, and you can calculate your profit. Here you can draw the levels at which you would trade. You can change the display speed in the settings.
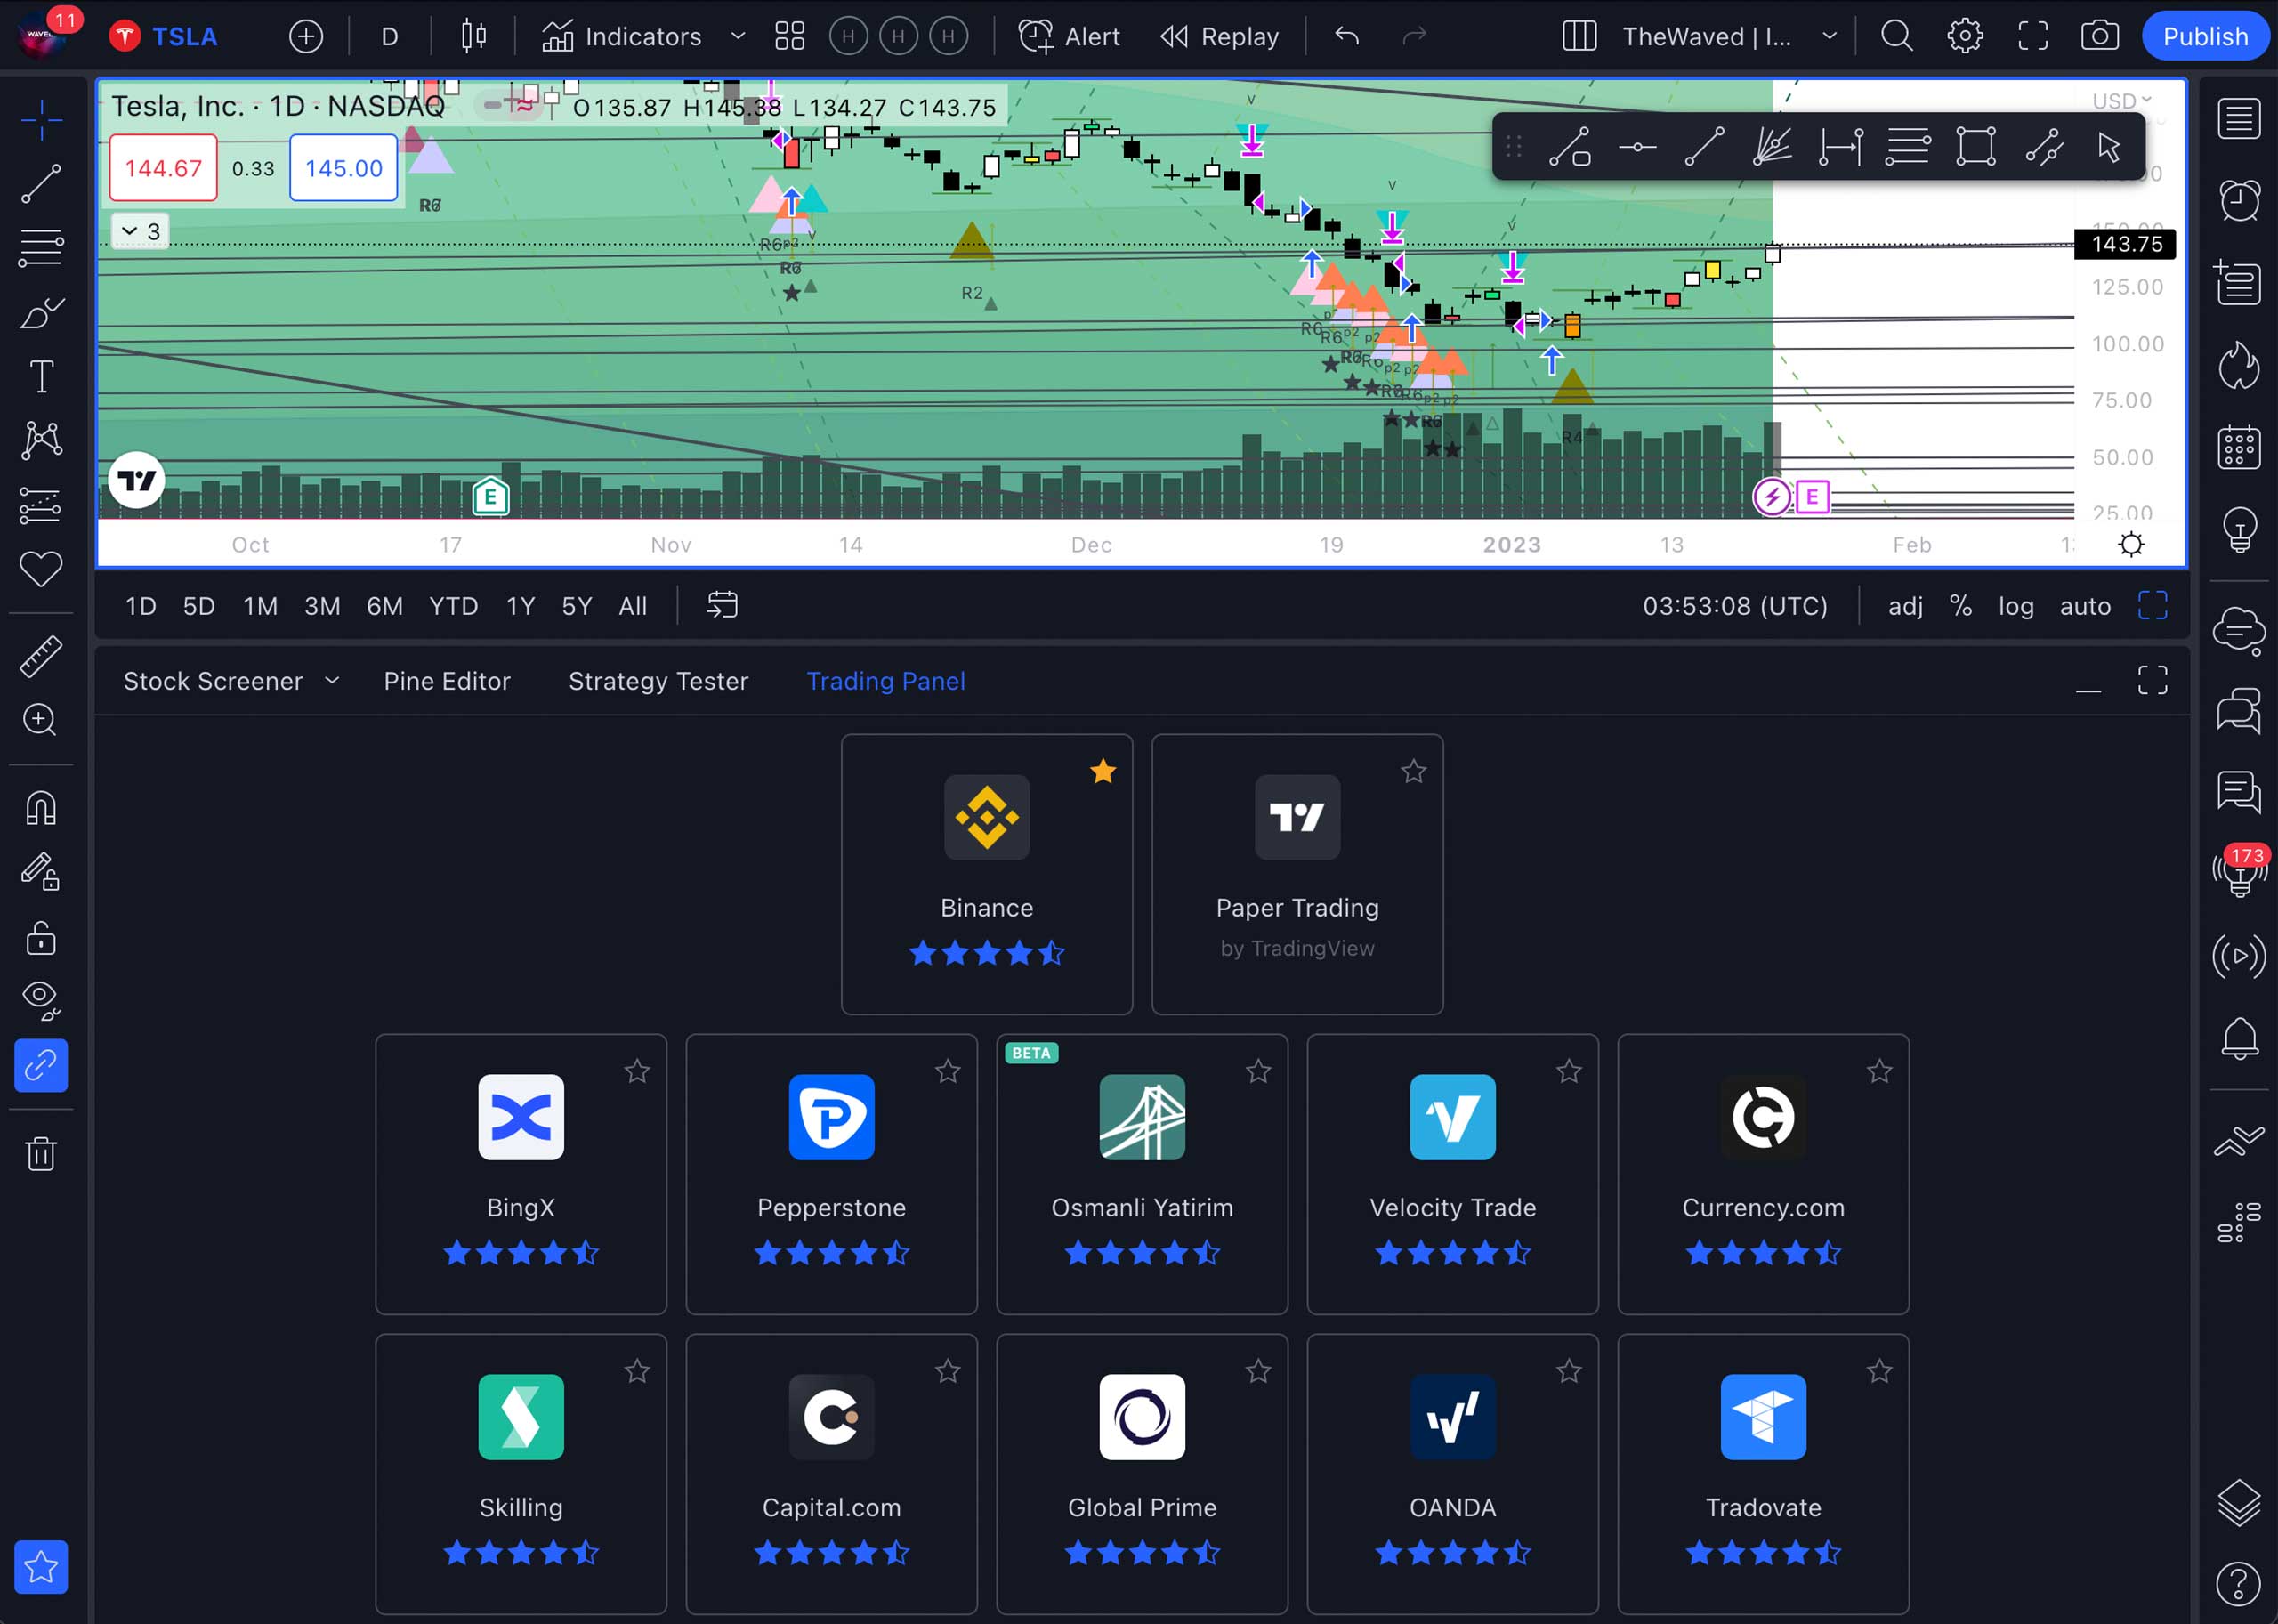
CONNECTING THE PAPER TRADING – TEST TRADING MODULE
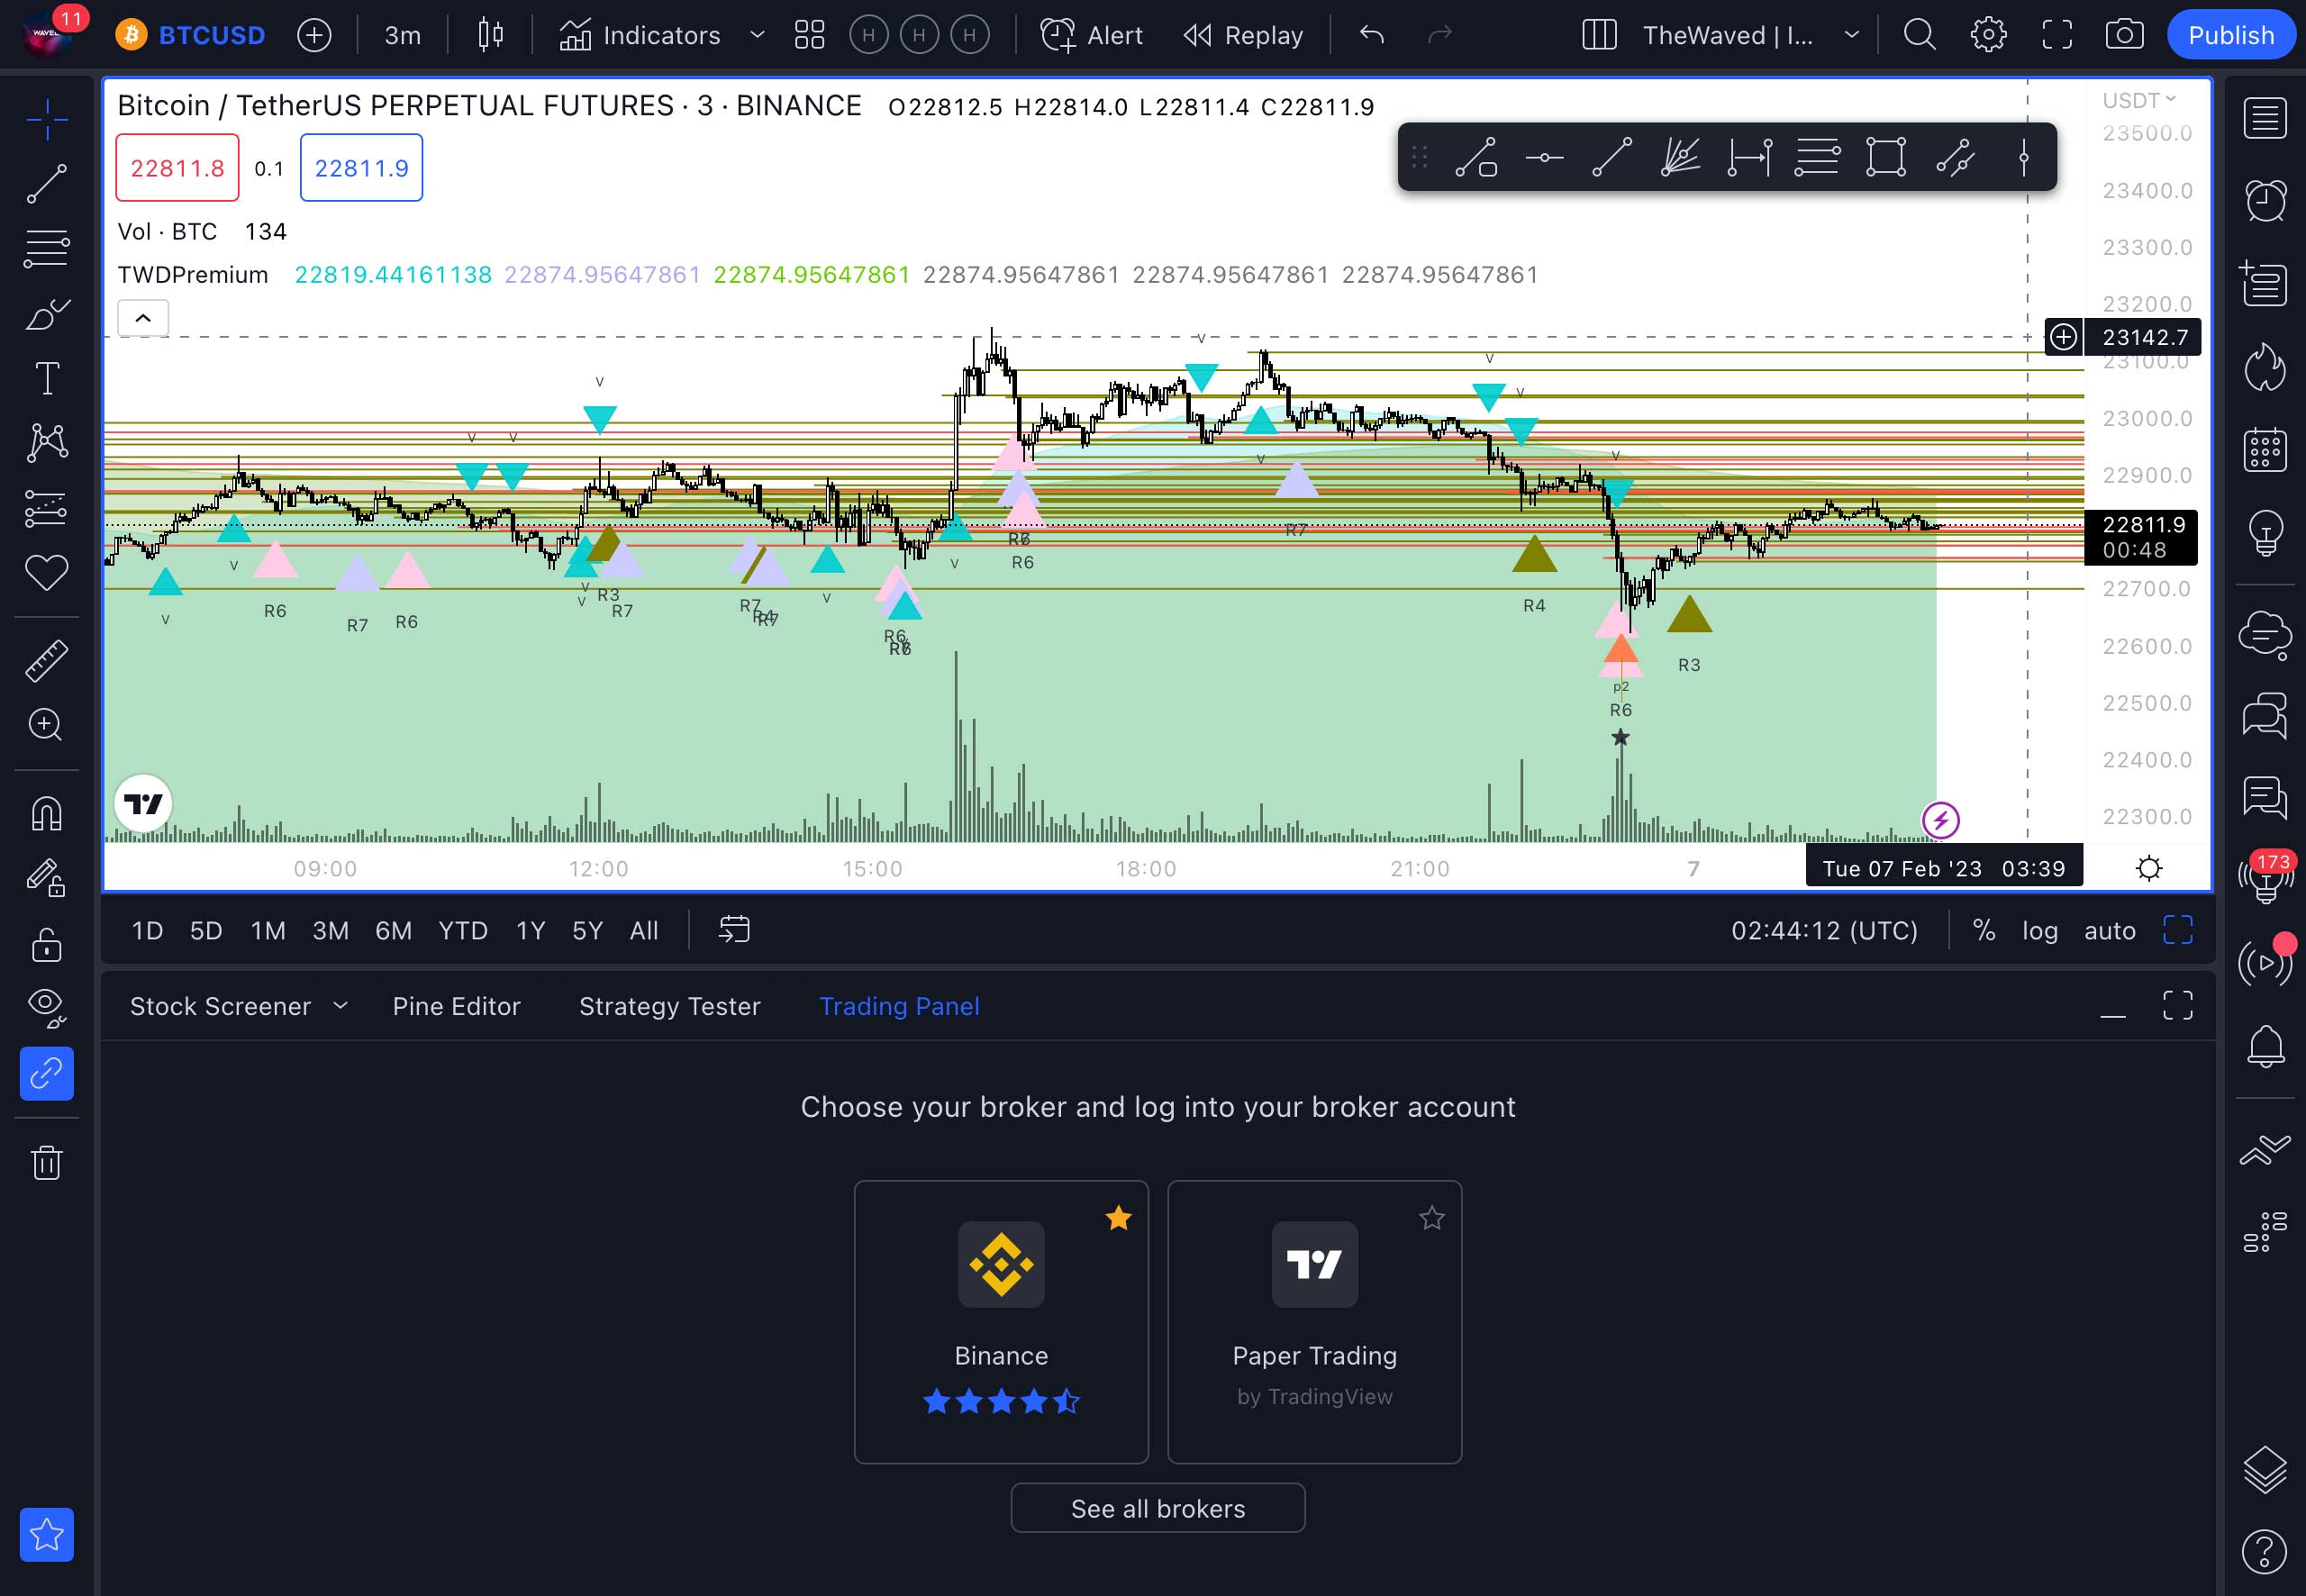
To try trading in real time, but without risk, you need to connect the Paper Trading module. To do this, select Trading Panel in the lower menu. And find Paper Trading there. Click the Connect button.
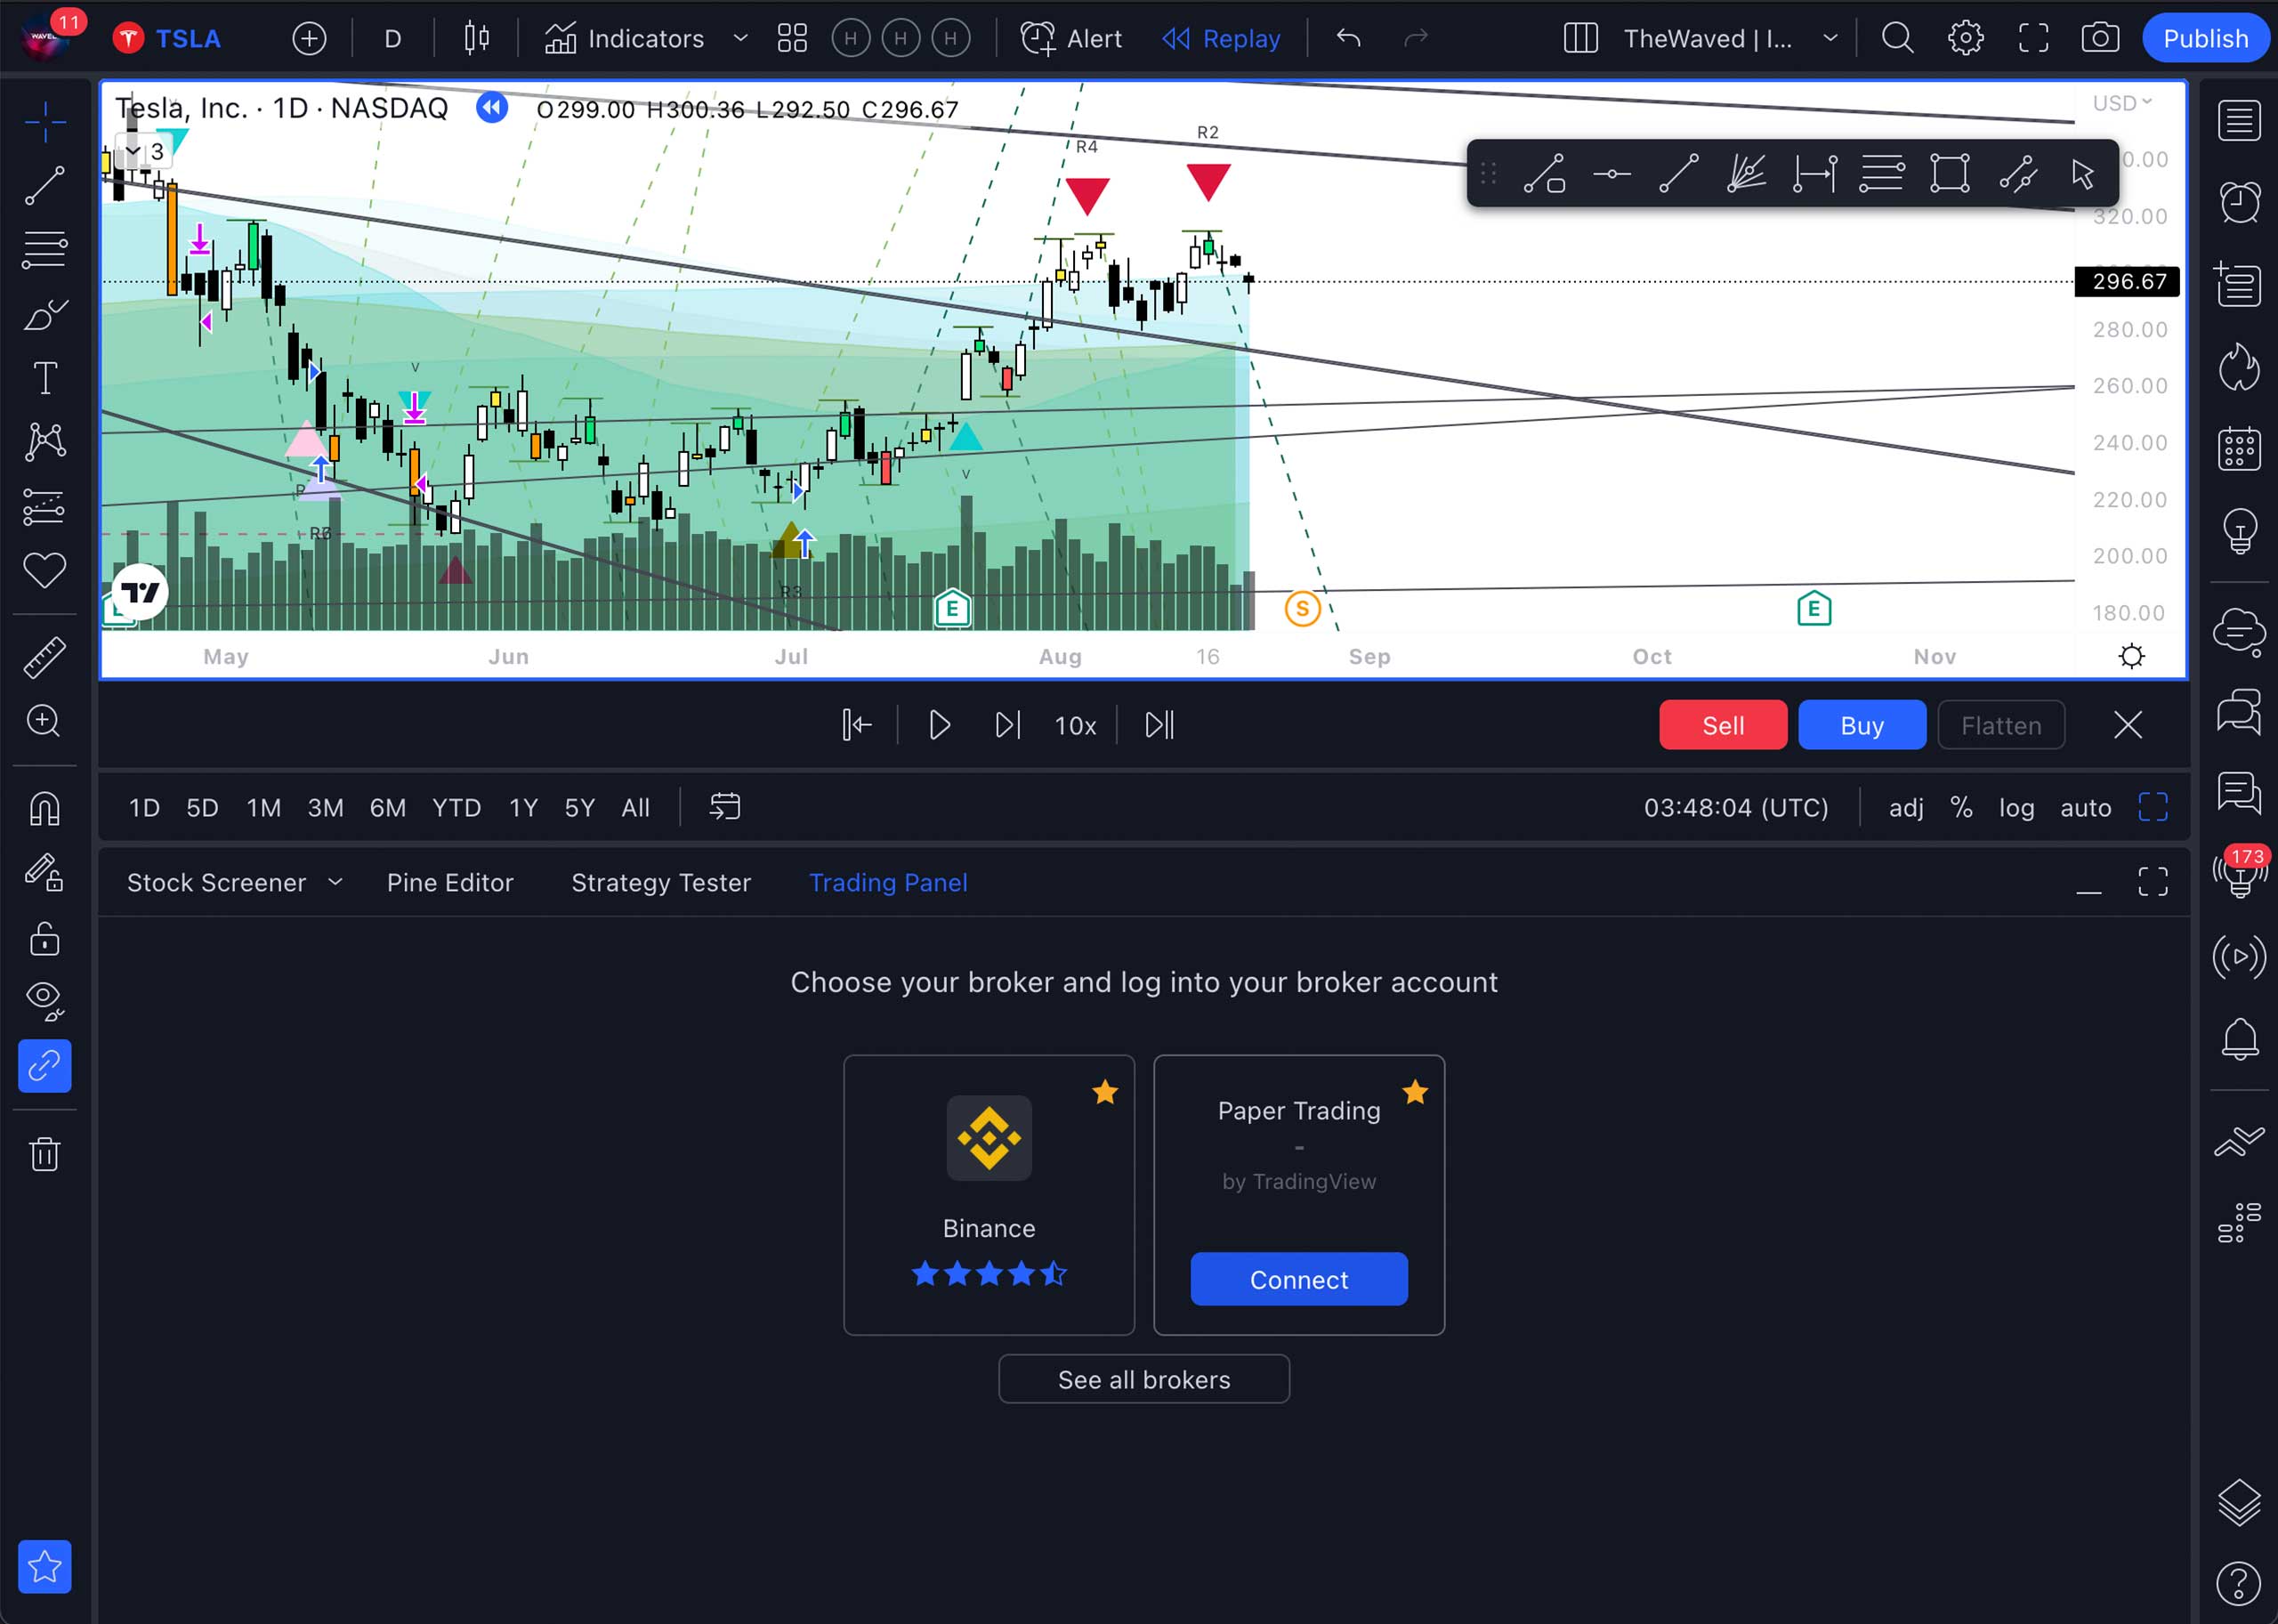
A new panel will appear on the screen where you can simulate real trading. This is where you can test your signals and your strategies. You can find a more detailed tutorial on this tool on Tradingview.
Binance connection and real trading
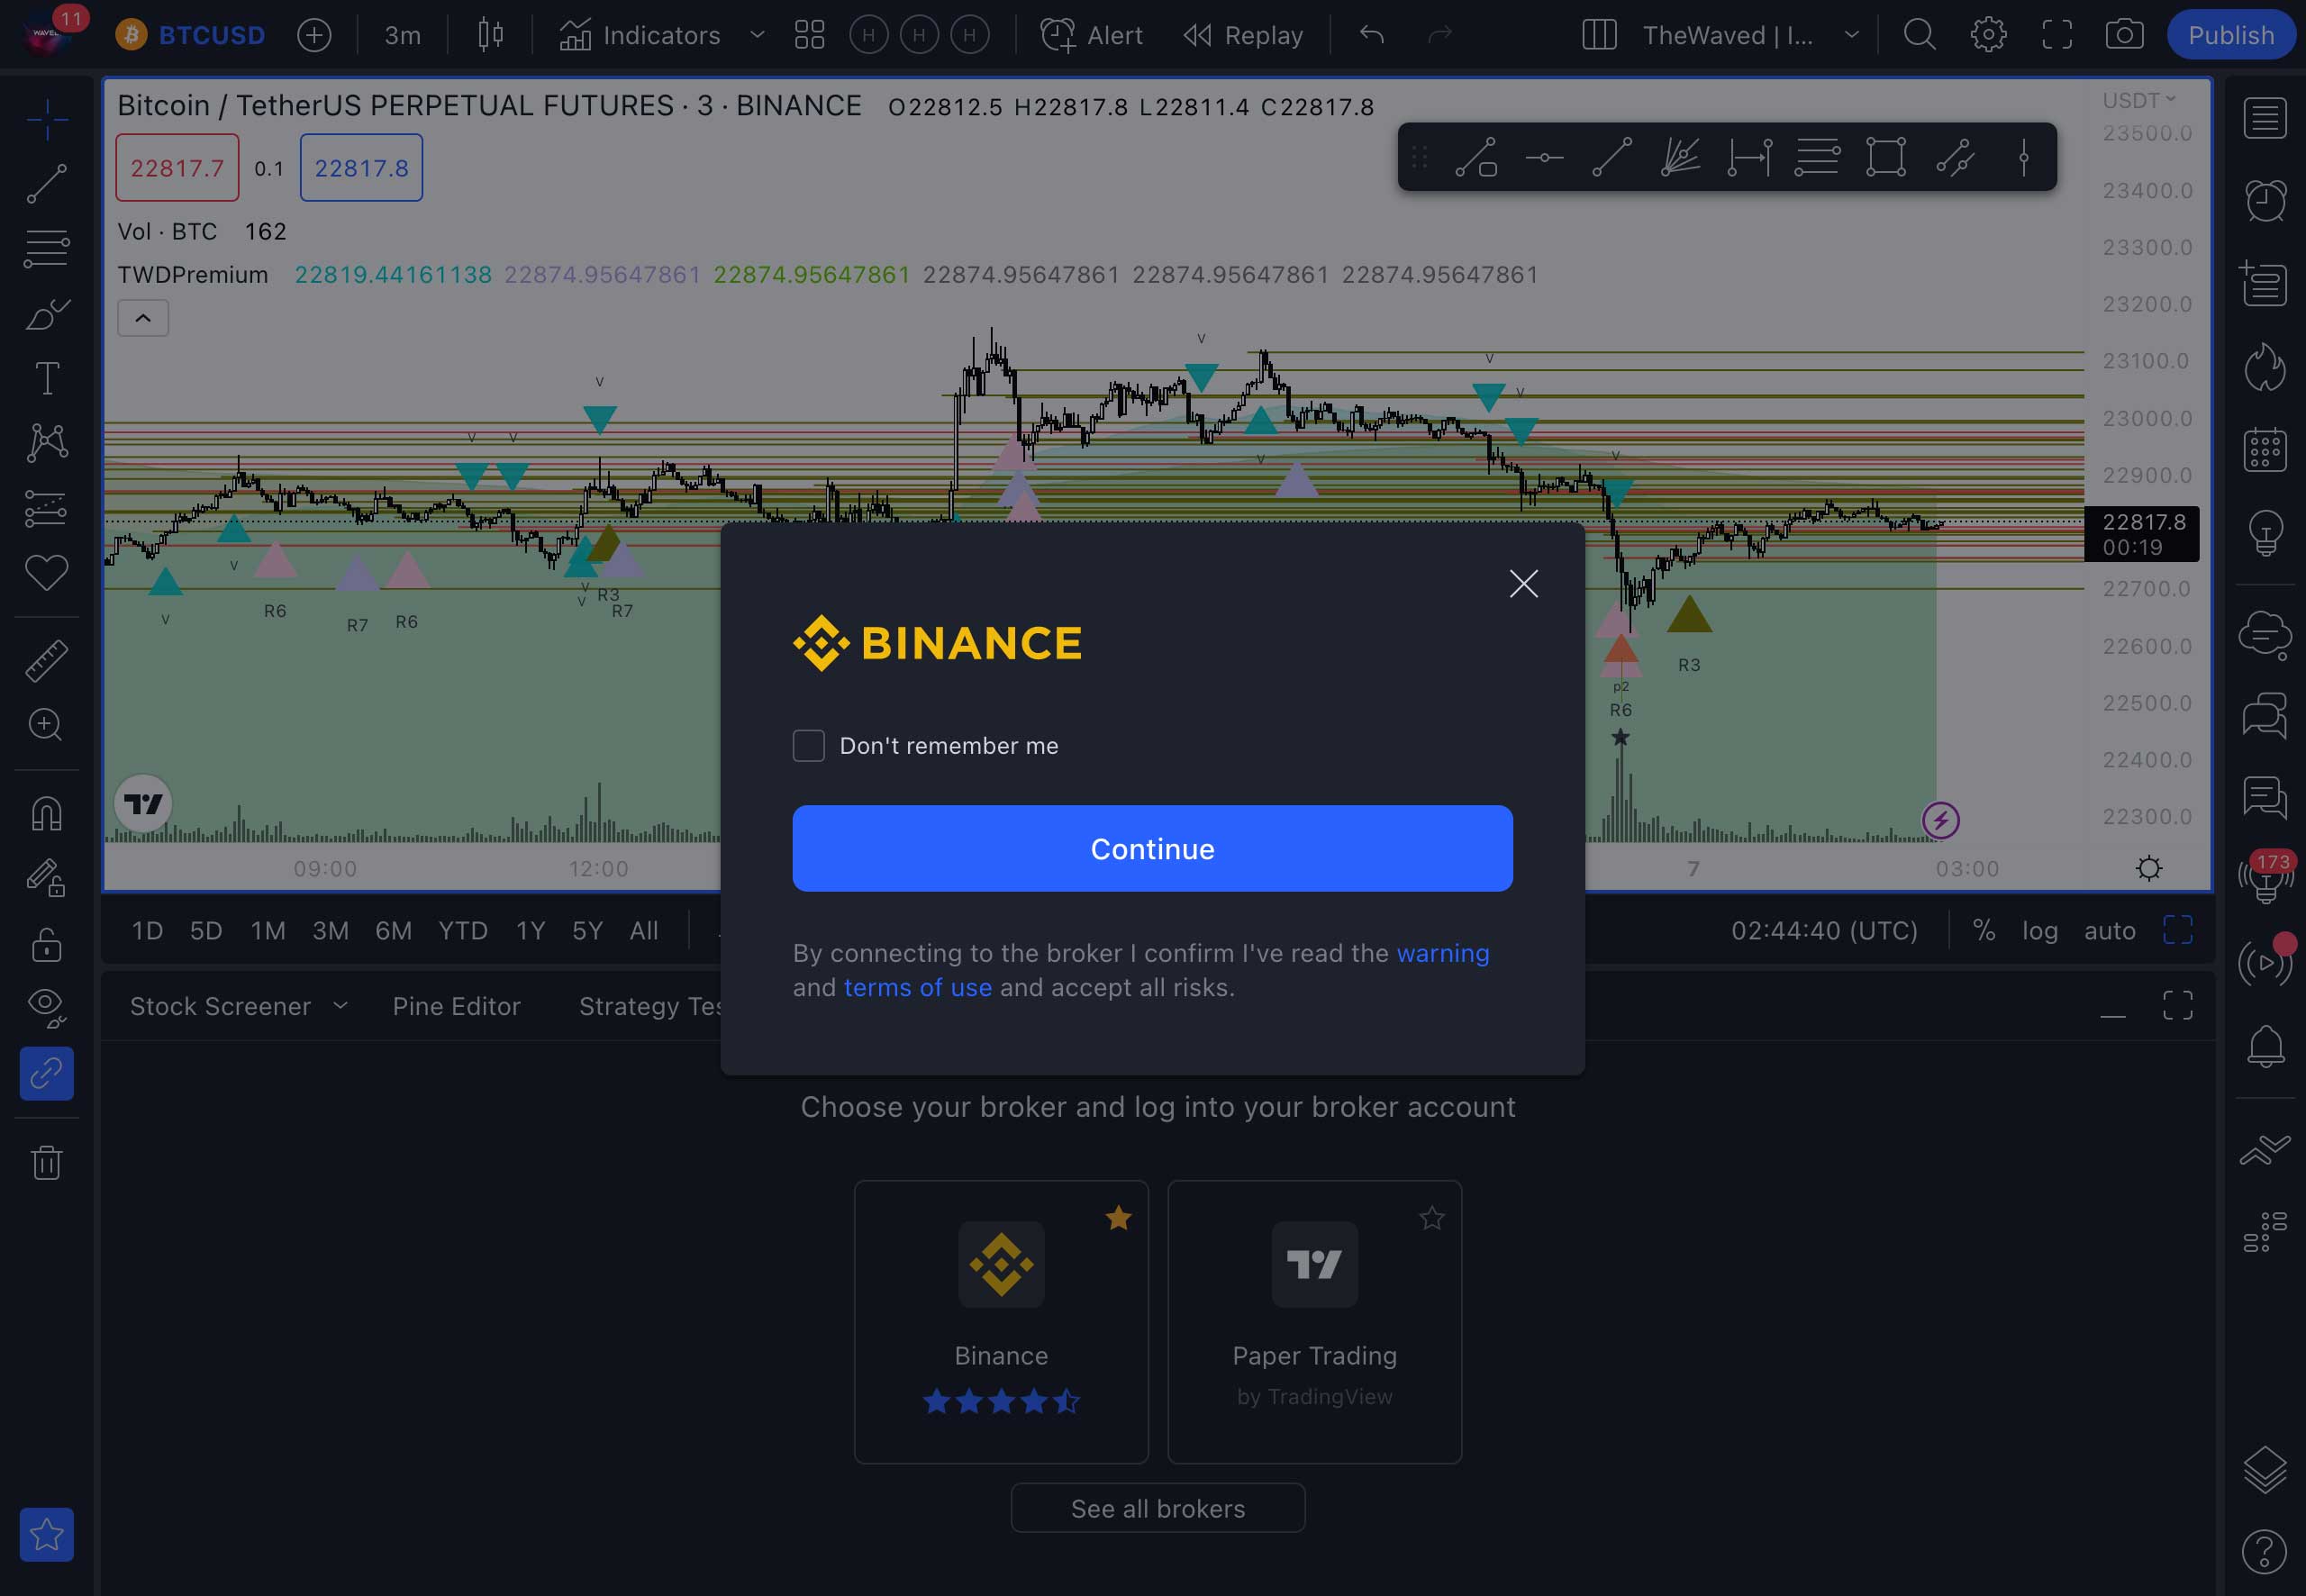
You can connect your Binance account to Tradingview to perform trades based on signals faster. To do this, simply select Binance in the Trading Panel section in the lower menu and click its Connect icon. Next, you will be redirected to the page of your exchange, where you will need to pass the authentication.
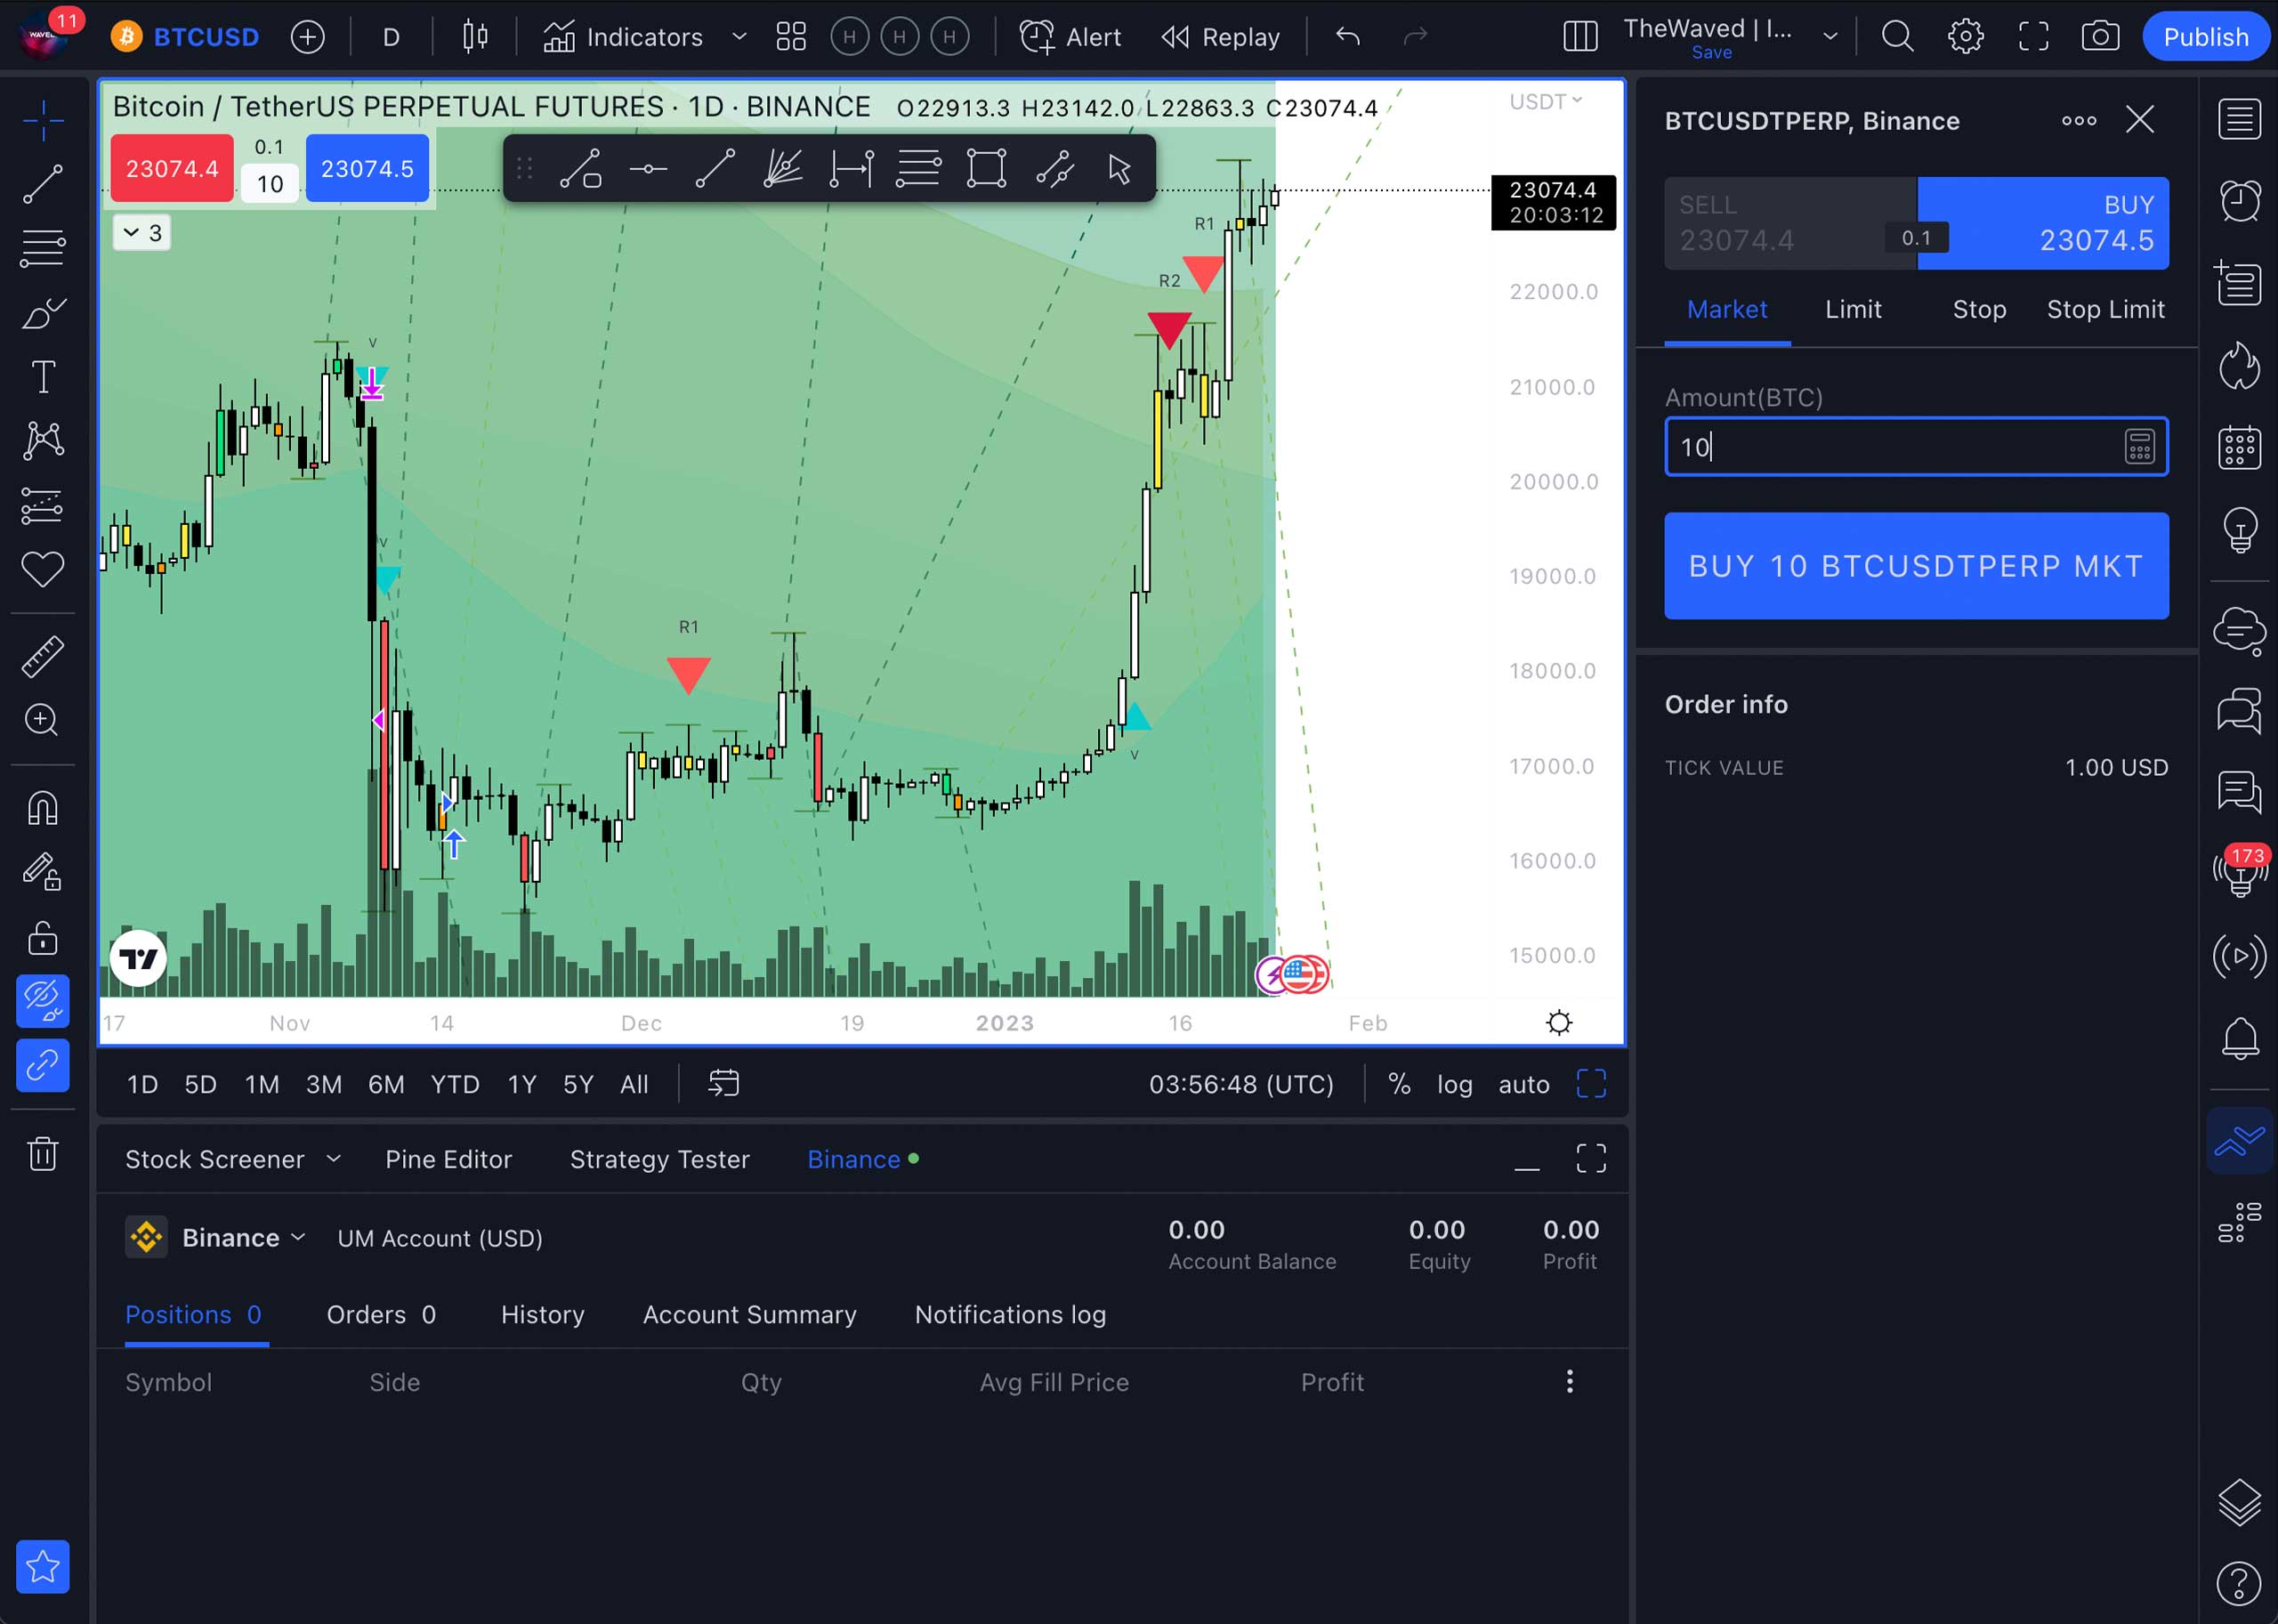
The Sell and Buy buttons will appear on the appeared panel. Now you can create an order to buy or sell an asset. To do this, right-click on the free part of the chart. In the pop-up menu, select Trade – Create new order.
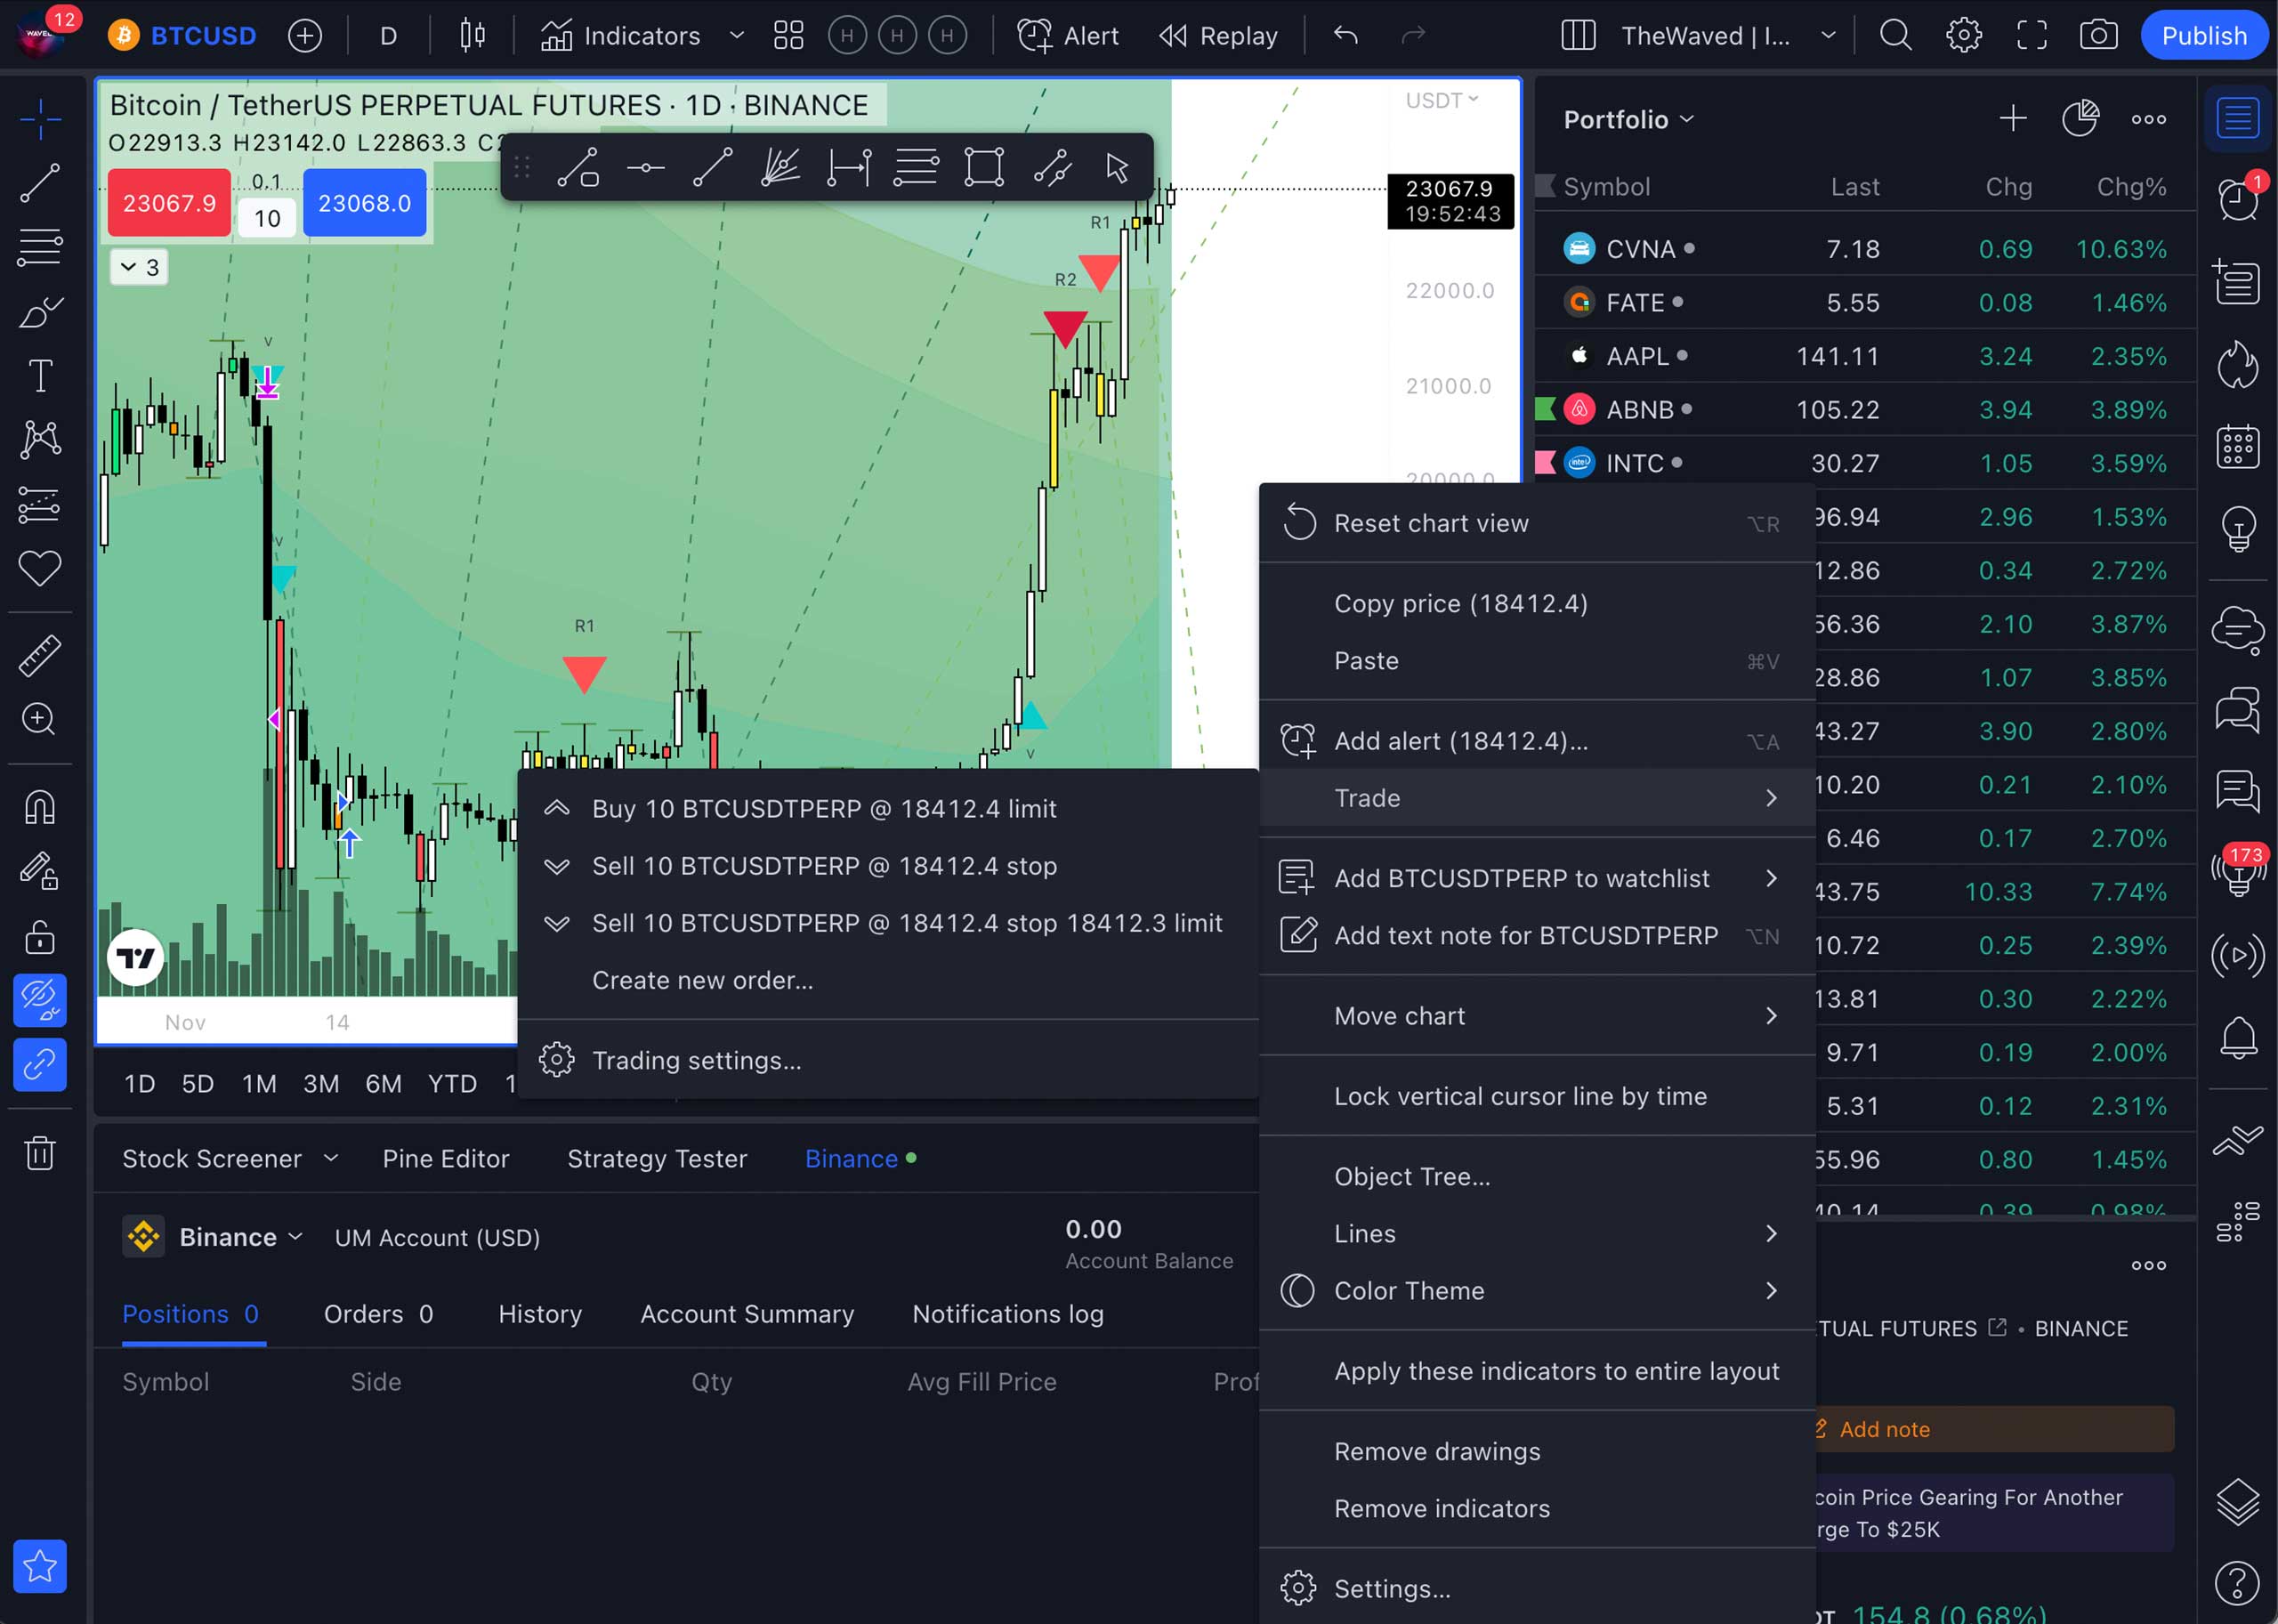
Then you create an order by filling in the fields in the trade section. Now follow the chart and wait for the next signal to close the trade. Also, the profit or loss on your transaction is shown on the chart in real time.
Importing a list of assets to Tradingview
On Tradingview, the Pro or higher subscription has a function for importing a list of assets that you want to monitor continuously. They can be added to the home screen. To do this, you need to create a TXT text file and fill it with a list of symbols indicating the assets you are interested in. Name the file the way you want to see it in the list. In order for the list to be imported correctly, it is necessary to fill in the file properly. The asset is added in the following format: provider’s name, colon and asset’s name. For example: BINANCE: BTCUSDT or MOEX: SBER. You can see the correct spelling of the asset in the asset search box.
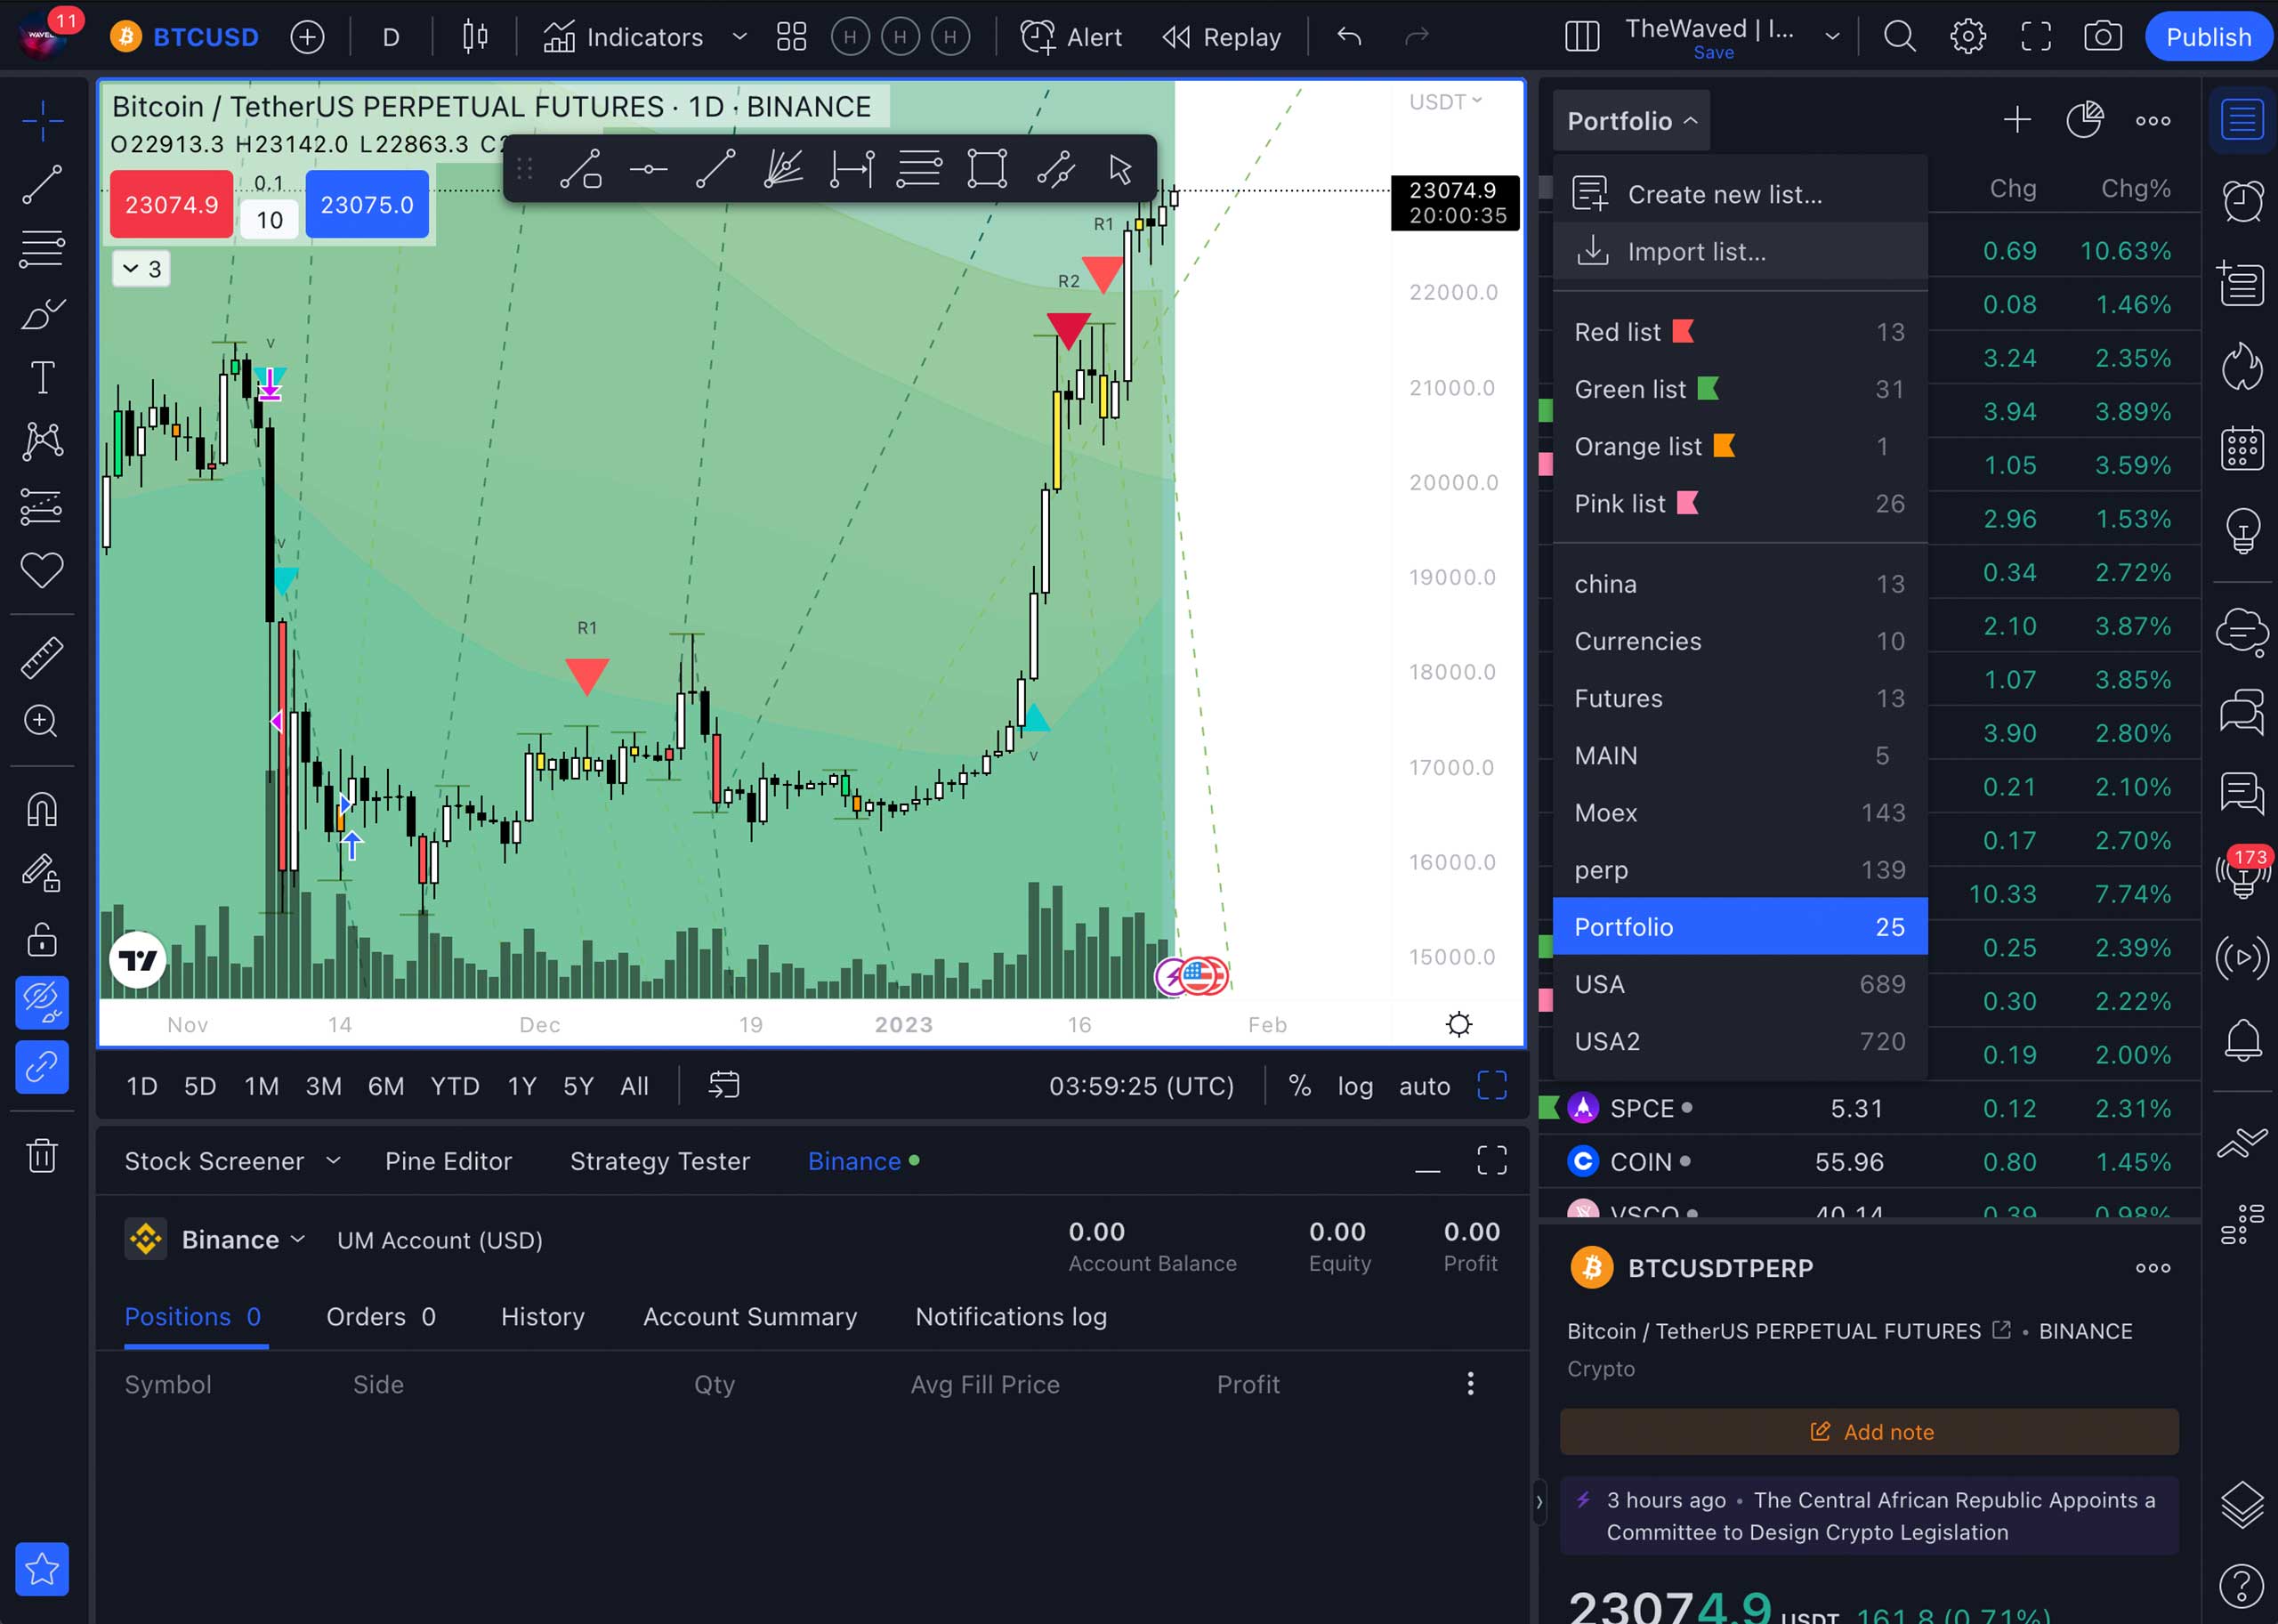
To add a list to the screen, click Import list, select your file, and click Open. In the window that appears, you will see a list of all available assets from your file. Inaccessible files will be shown in red.
If you don’t need the list anymore, left-click on it. In the pop-up menu, delete it by clicking the cross icon.
Example of an import file with Binance (Futures) assets.
Account
In this section, you can find answers related to the work of the site.
Creating and changing a password
After placing an order, you will receive an email confirming registration on our website. It will contain an automatically created login and a link for changing the password. Clicking this link will take you to your personal profile, where you can set a new password.
FORGOT PASSWORD
If you forgot your password, go to My account, then – Personal account. Click Forgot password and enter your email address or the automatically assigned username in the window that opens. Click the Reset Password button. You will receive an email with a link to create a new password. You should follow it and create a new password.
Viewing and renewing orders
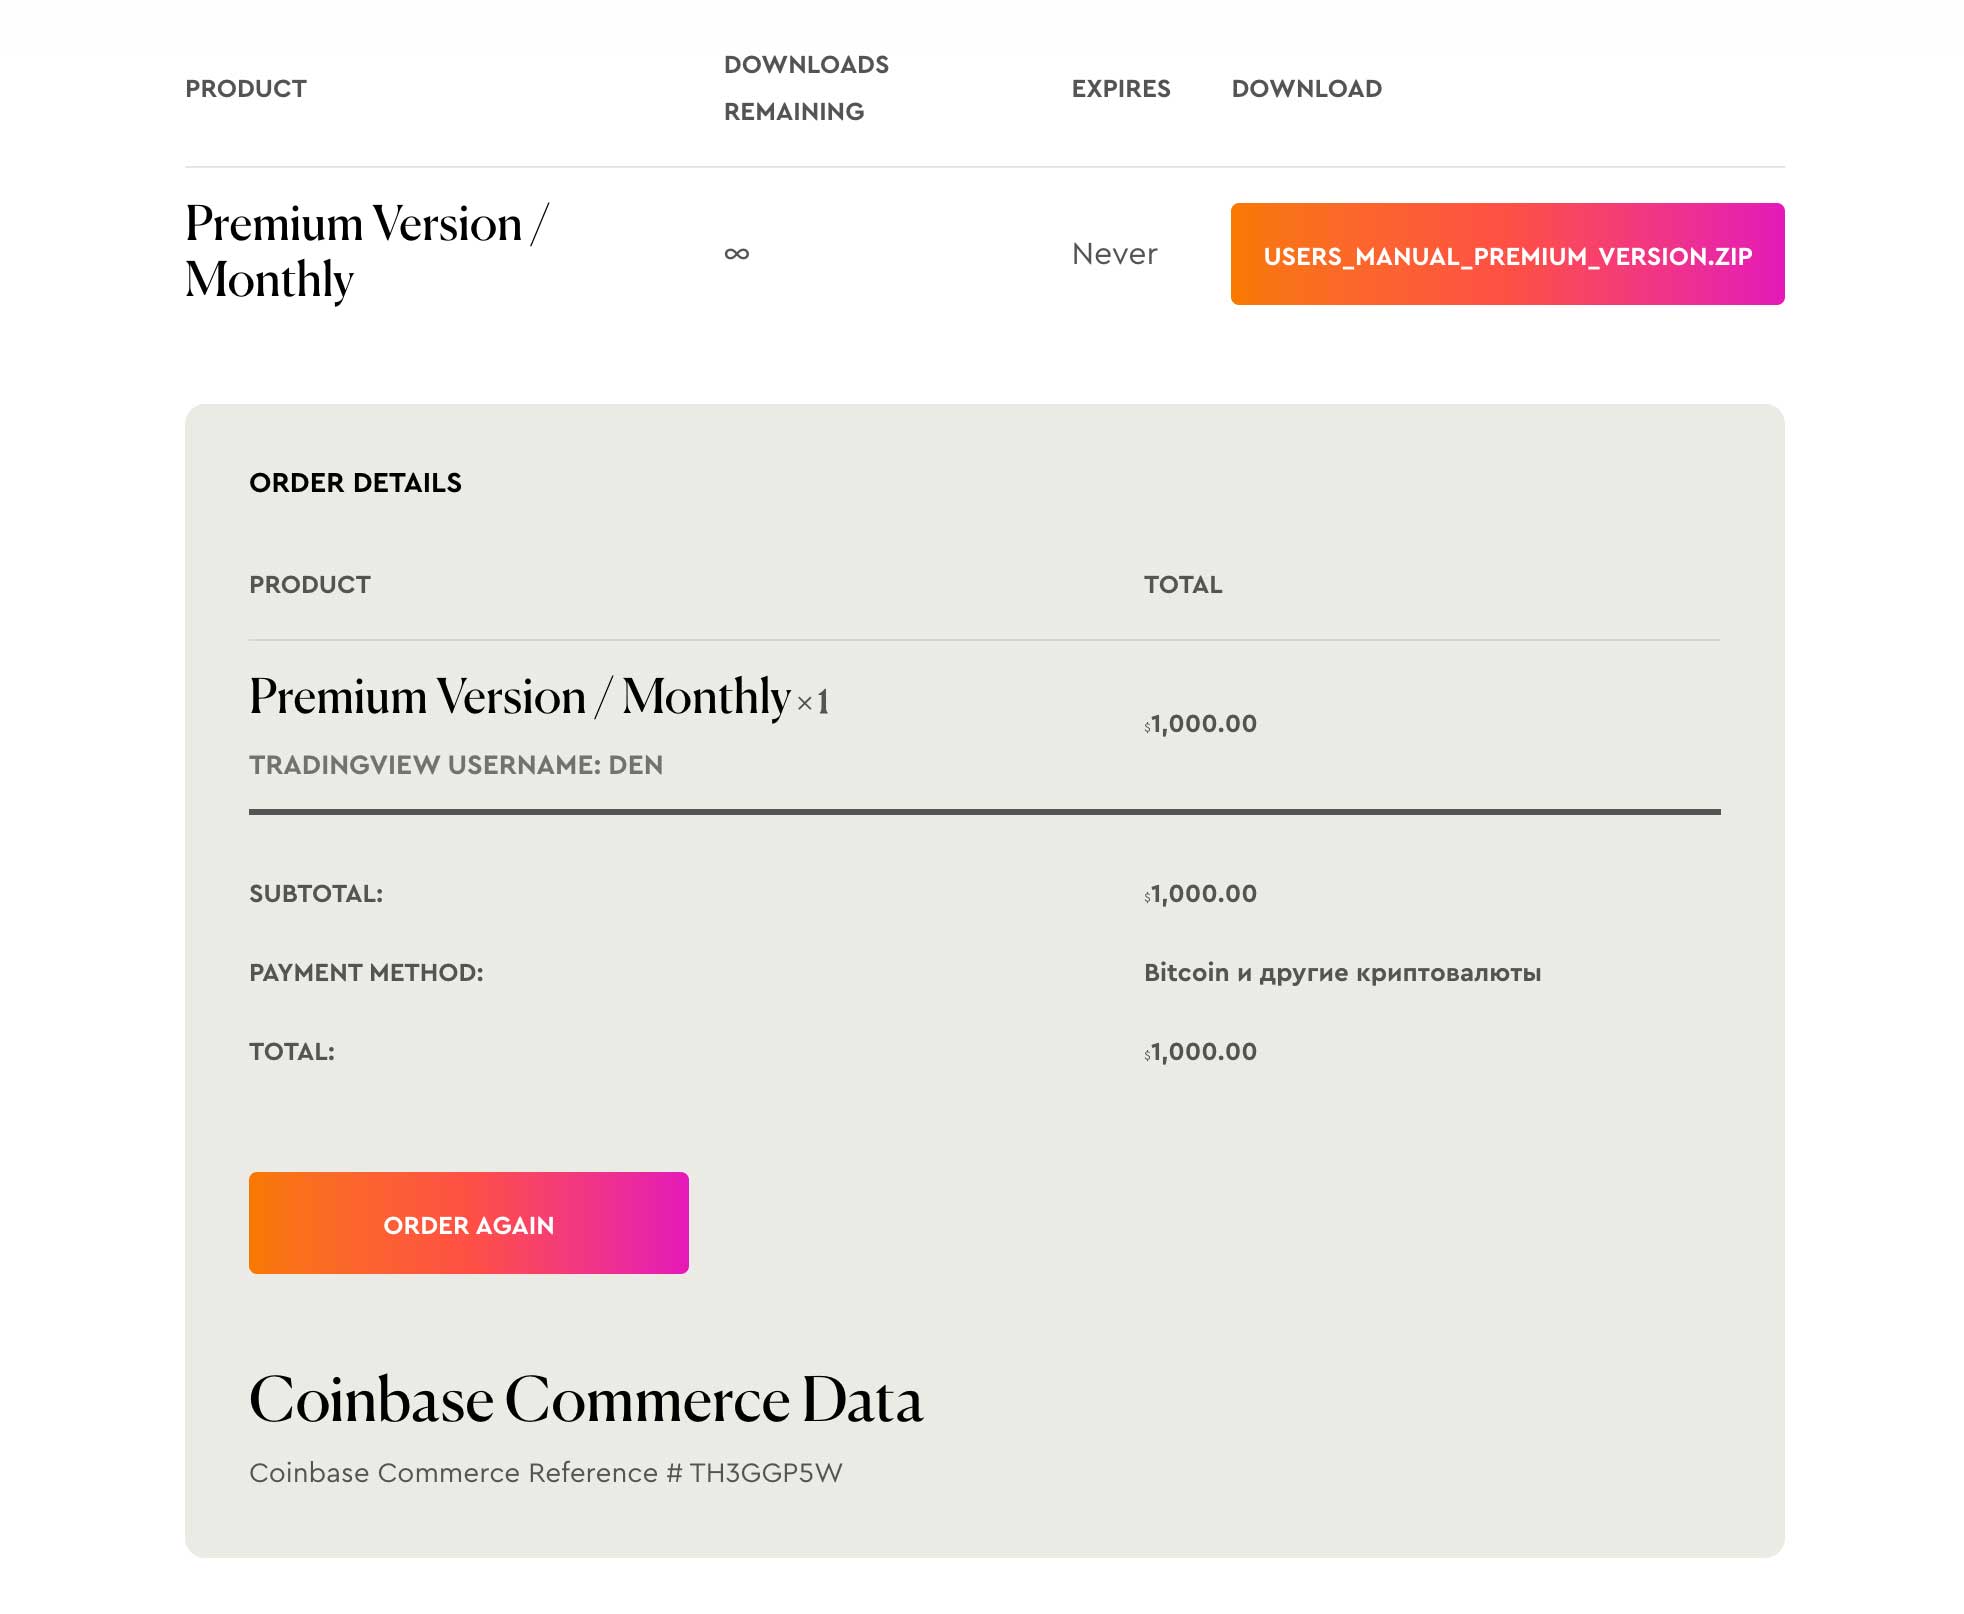
After placing an order, you will receive an email confirming the payment for your order. In the email, you will find a link for downloading a detailed user manual for the indicator version you paid for. You can also view the order details and status, as well as download the user manual in your personal account in the My orders tab.
The download will not be available if your order has not been paid yet or has Pending status. You need to activate the order by the support service.
To extend your order, you can use Order Again button.
Working with The Waved indicator
You can download a detailed guide on using the indicator after subscribing.
Introduction
Trading is not an ordinary job where you work from nine to six and get a fixed salary. This is not a business where you can calculate profits and possible losses. Trading is a special way of life and thinking; it’s a different world where you can earn good money without working your fingers to the bone.
But trading is also a risk. After all, it is impossible to completely predict the market because it reacts like a living organism to various events in the world. There is no place for standard planning models in it, you can only calculate the percentage of probability. Statistics and numbers rule here. Therefore, it is very important to have an advantage in trading.
The Waved Indicator is exactly the advantage that will help you be in the right place at the right time! It gives you the opportunity to open a trade with minimal risk and at the best price. Whether you take advantage of it or not – it’s up to you! Have you ever regretted a missed opportunity? Like not buying Bitcoin in 2020, or Tesla in 2019? Of course, if you knew what would happen to the price of these assets in a year, you would definitely take a risk!
Now you have a plenty of opportunities in your pocket. No one can guarantee where the asset price will go. But our indicator gives the right signals in 92% of cases, and with personal strategies it reaches 100%! No other indicator can show such results, but we can! Buy low and sell high – that’s the principle of successful trading implemented in the indicator. And now you can use it to your advantage. The Waved Indicator will become your guiding star in the world of finance!
We believe that there is always an opportunity to earn and change your life. You just have to recognize it in time and use it. And there are a lot of opportunities in trading, because something happens in the market every day. In fact, the signal is a lucky chance that many have been looking for for years. And our indicator gives it regularly. That is why we invite you to join the lucky ones who are already using our product. Because we are more than 100% sure about it!
How It Works
How does The Waved Indicator work? Everything is simple for you: the indicator performs all complex calculations. It analyzes the market situation by a variety of different parameters (VSA, technical analysis, indicators, trading volumes, patterns, and others) and gives a signal when a new bar opens on its time interval.
Stop Loss and Take Profit /signals are given at the moment when the price crosses the threshold specified in the strategy.
Signals always give an advantage, as they appear on large drops in the asset price. Thus, you get the best price for buying the asset when market dynamics, technical analysis, and behavior of the big players indicate further growth. In moments of market manipulation, where many lose, you get an excellent price for gaining a position and profit.
When will you receive the signals? It all depends on the timeframe you choose. If there are conditions for a profitable trade in the market, then on the minute timeframe signals will be given at the beginning of each minute, on the daily – at the beginning of each day, on the weekly – on the first day of trading of this week, and so on. This means that the best time to open a trade is the time period when the signal is given.
And then you can either wait for the next signal to close the trade or close it at the moment when you want to take the profit.
Where the indicator should be used
Our indicator works equally well in all markets. Whether it’s a stock, futures, or cryptocurrency market. But the markets themselves differ from each other in dynamics, so it is important to use the indicator on a suitable timeframe.
STOCK MARKET
In the stock market, we recommend paying attention to signals on daily timeframes. Many hedge funds and major players make a decision in the evening or the next trading day and, at some point, a lot of players enter the market. Thus, an hourly signal in the stock market gives better entry points than a daily one. But this means that you should be able to enter the market during the day, and this, in turn, can attract your attention to the market and lead to additional time costs, so you should be ready for this.
CRYPTOCURRENCY MARKET
The cryptocurrency market is much more dynamic and faster than the stock market. Here, transactions are made around the clock, so it is important to take this into account in order to see and hear the signal in time. We recommend setting up signals on timeframes from 1 to 8 hours.
FUTURES
The futures market also features huge dynamics, so it is better to use timeframes from 5 minutes to 1 hour. And for intraday trading, it can reach up to a 5-second timeframe in terms of speed!
When trading with leverage, it is better to use faster timeframes, since the risks are higher here, and the speed of transactions is very high.
How to use the indicator depending on your preferences and needs
Real trading is a real job, albeit an unusual one. You can earn a lot here, but you also need to devote time to it accordingly. The good news is that our indicator can be successfully used not only by an experienced trader, but also by a beginner who is ready to devote a minimum of time to trading.
Depending on the time you are willing to devote to trading and your willingness, there are four ways to use the indicator.
I WANT TO EARN MONEY WITHOUT GOING INTO DETAILS
If you don’t know anything about the market and don’t want to learn all the subtleties, the PRO version of the indicator will suit you. You will need to set up signals for strong (large) timeframes and assets of companies you believe in and would like to invest in. For each market these will be different timeframes, for stocks – weekly or monthly, for crypto – daily.
At the moment of receiving the signal, you will need to open the trade. This can happen once a week, once a month, and even once a year. But these signals are the most accurate.The strategy will also show you when to close a trade. But you can take profit on your own, if you are satisfied with the profit earned.
The disadvantage of this strategy is that it is impossible to predict when there will be a signal. Therefore, you can only wait for the opportunity and use it in time.
I WANT TO QUICKLY LEARN THE THEORY AND START EARNING
If you have free time and you are ready to spend it on understanding the trading process, then you should use the Master version. The PRO version is also suitable, but only at the very beginning of your journey as a trader. After all, understanding the trading mechanisms will happen only when you master the indicator settings and try to change them.
In the process of trading and using the indicator, you will understand the risk/profit parameters, the strategy’s profitability, and so on. This will allow you to feel more confident in the market. And when a signal is received.
I WANT TO UNDERSTAND TRADING WELL
If you want to devote a lot of time to trading, or already have experience trading on the stock exchange, then the Master version will also suit you. With it, you will be able to create your own trading strategies that can give up to 100% correct signals. In this case, the profit of your transactions will grow, and the risks will be minimized..
I WANT TO DEVOTE MYSELF TO TRADING AND DEVELOP MY OWN STRATEGIES
If you are already an experienced trader and trading is your main source of income, the Premium version will be the best option for you. It enables you to work and develop in several directions. Namely:
- Trader – daily engaged in trading, swing trading, long-term trading on hundreds of strategies.
- Financial consultant – diversifies the capital of clients, finds the perfect moments to open the trades.
- Investor – diversifies capital, gains positions, uses world markets.
Our team uses this version. There are thousands of variations and opportunities to get rich and manage your own and other people’s capital. It takes time or assistance of a consultant to master all the functions of this version of the indicator.
Setting up your strategy
Configuring your custom strategies is available to Master and Premium version users. As you can see, all the popular and most accurate technical analysis tools are implemented in the TheWaved indicator. Using it, you can create the most profitable strategies that will allow you to reach a new financial level.
You have an incredible opportunity to predict the market and make transactions with maximum profit. Even when most lose their money. You will always be one step ahead, once you understand the principle of indicator’s operation and follow its signals.
Depending on the version, you will be able to build strategies with up to 100% profit at any time interval.
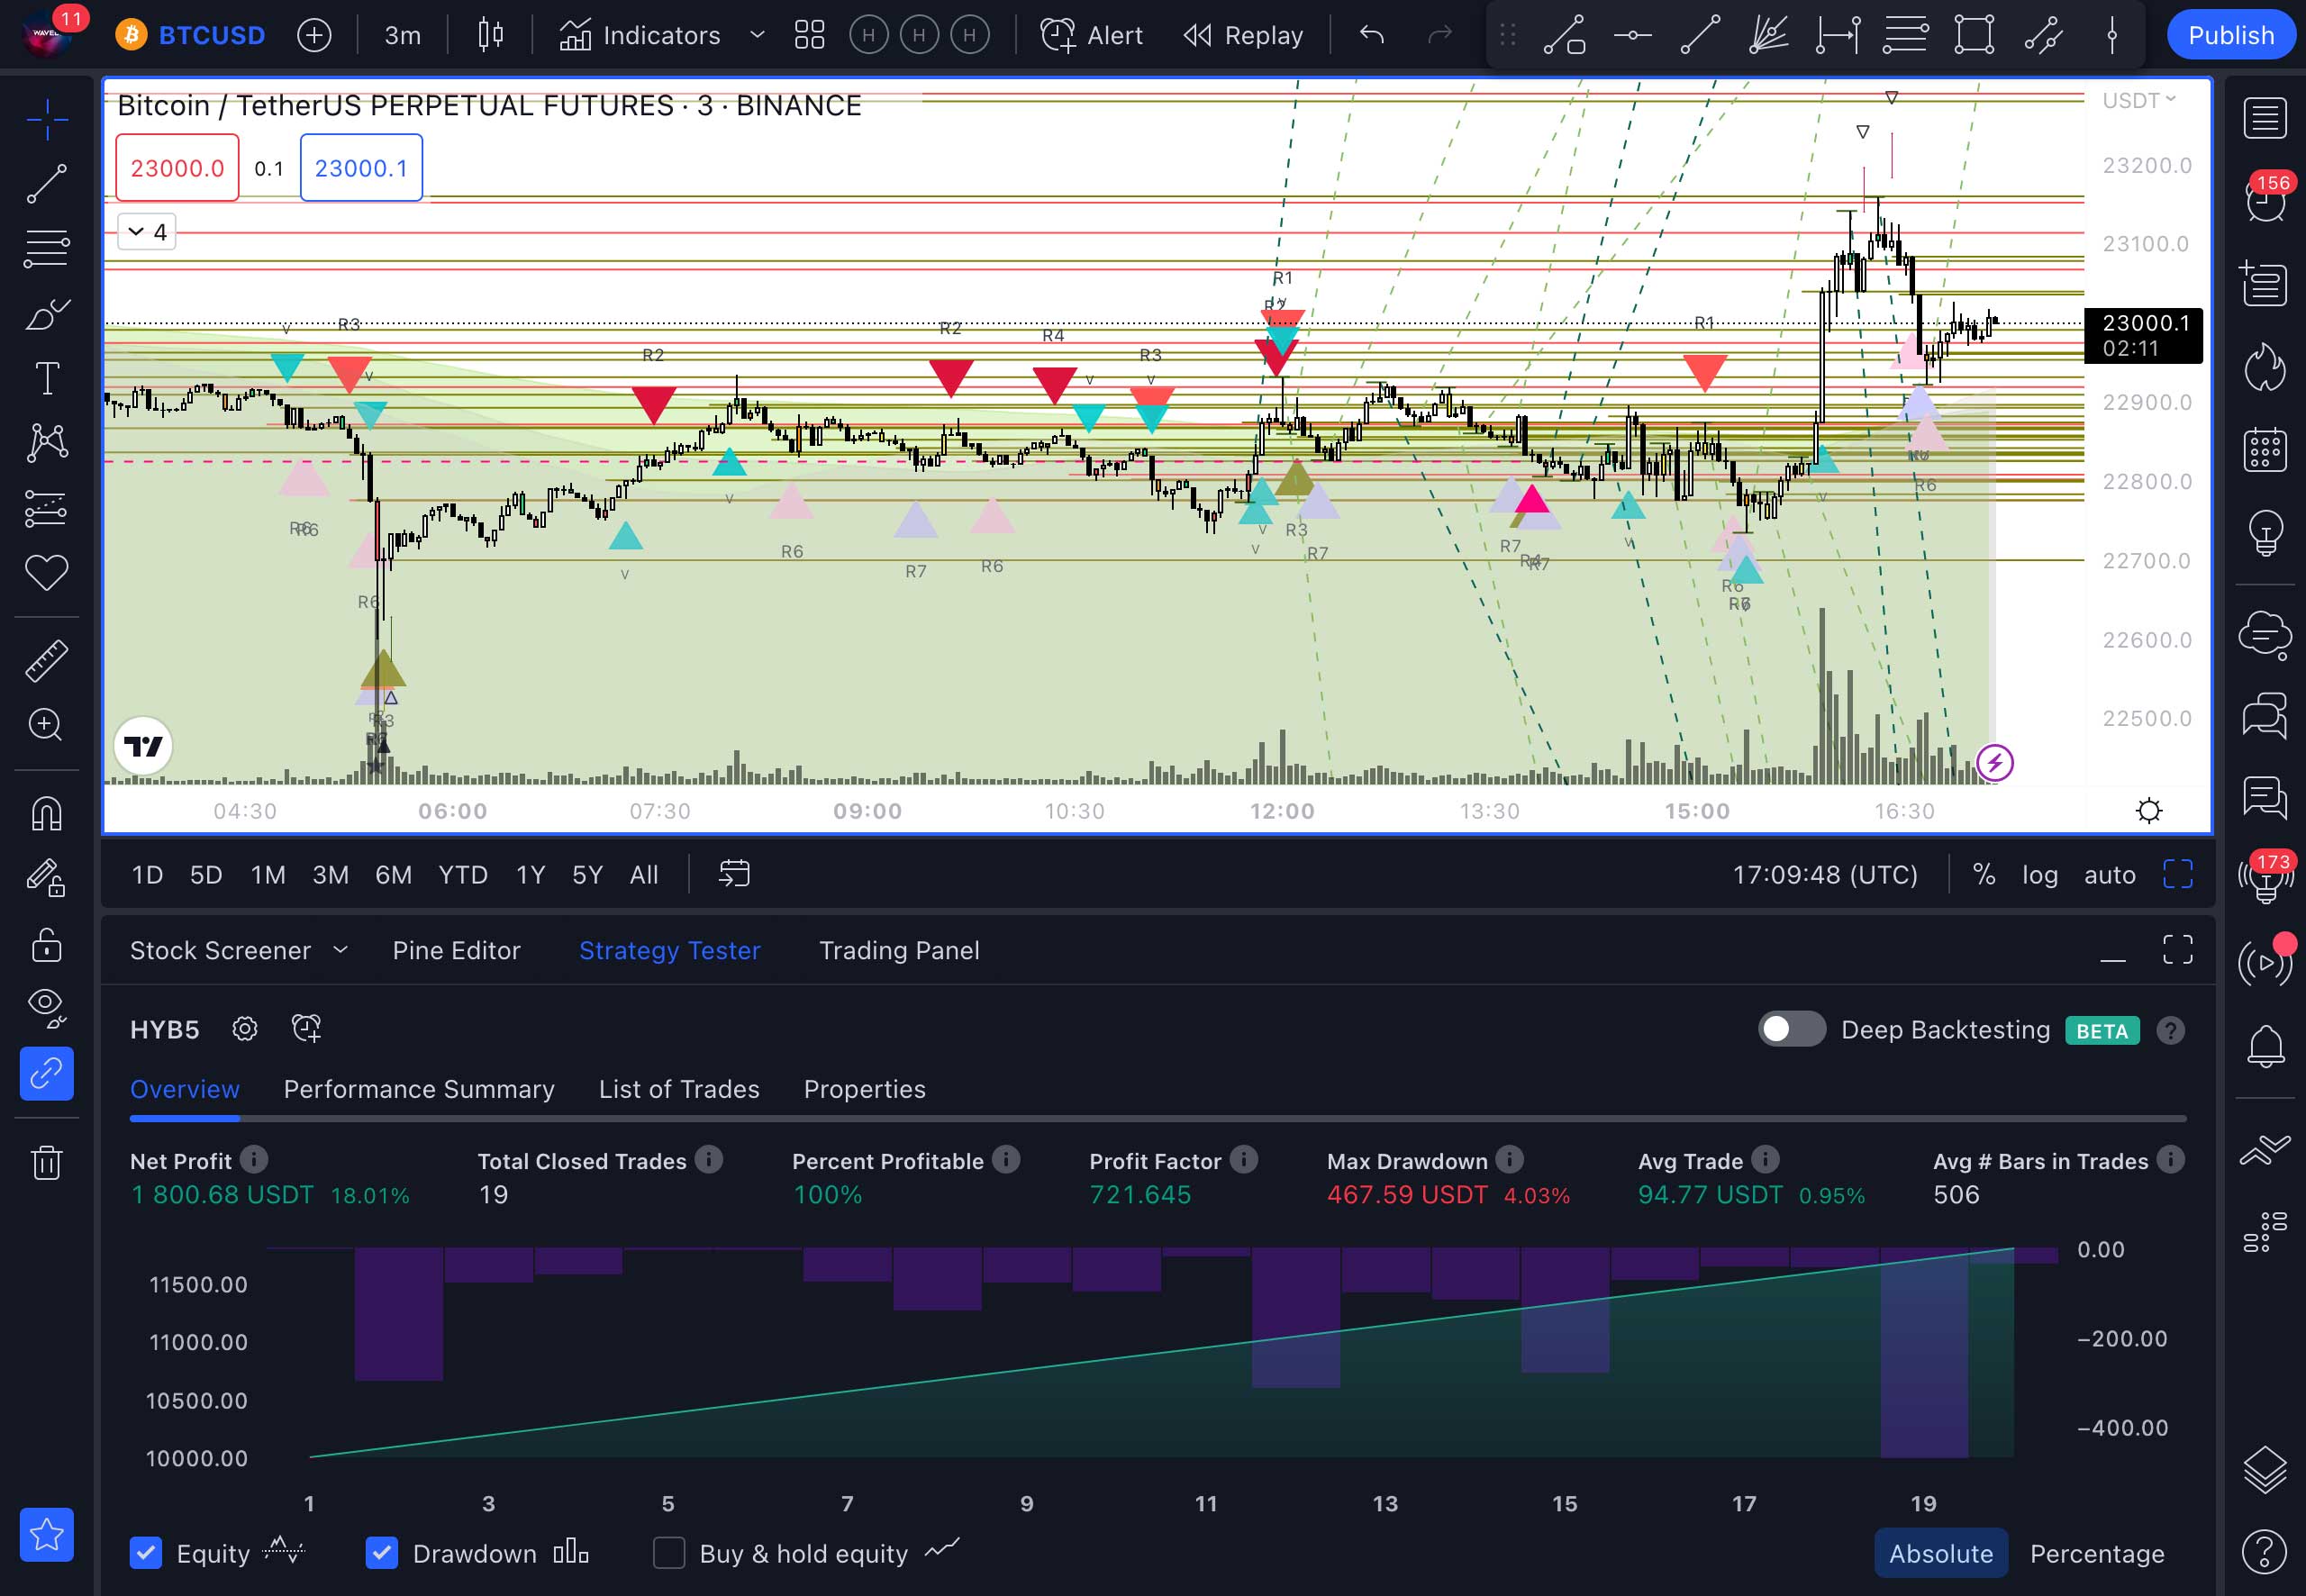
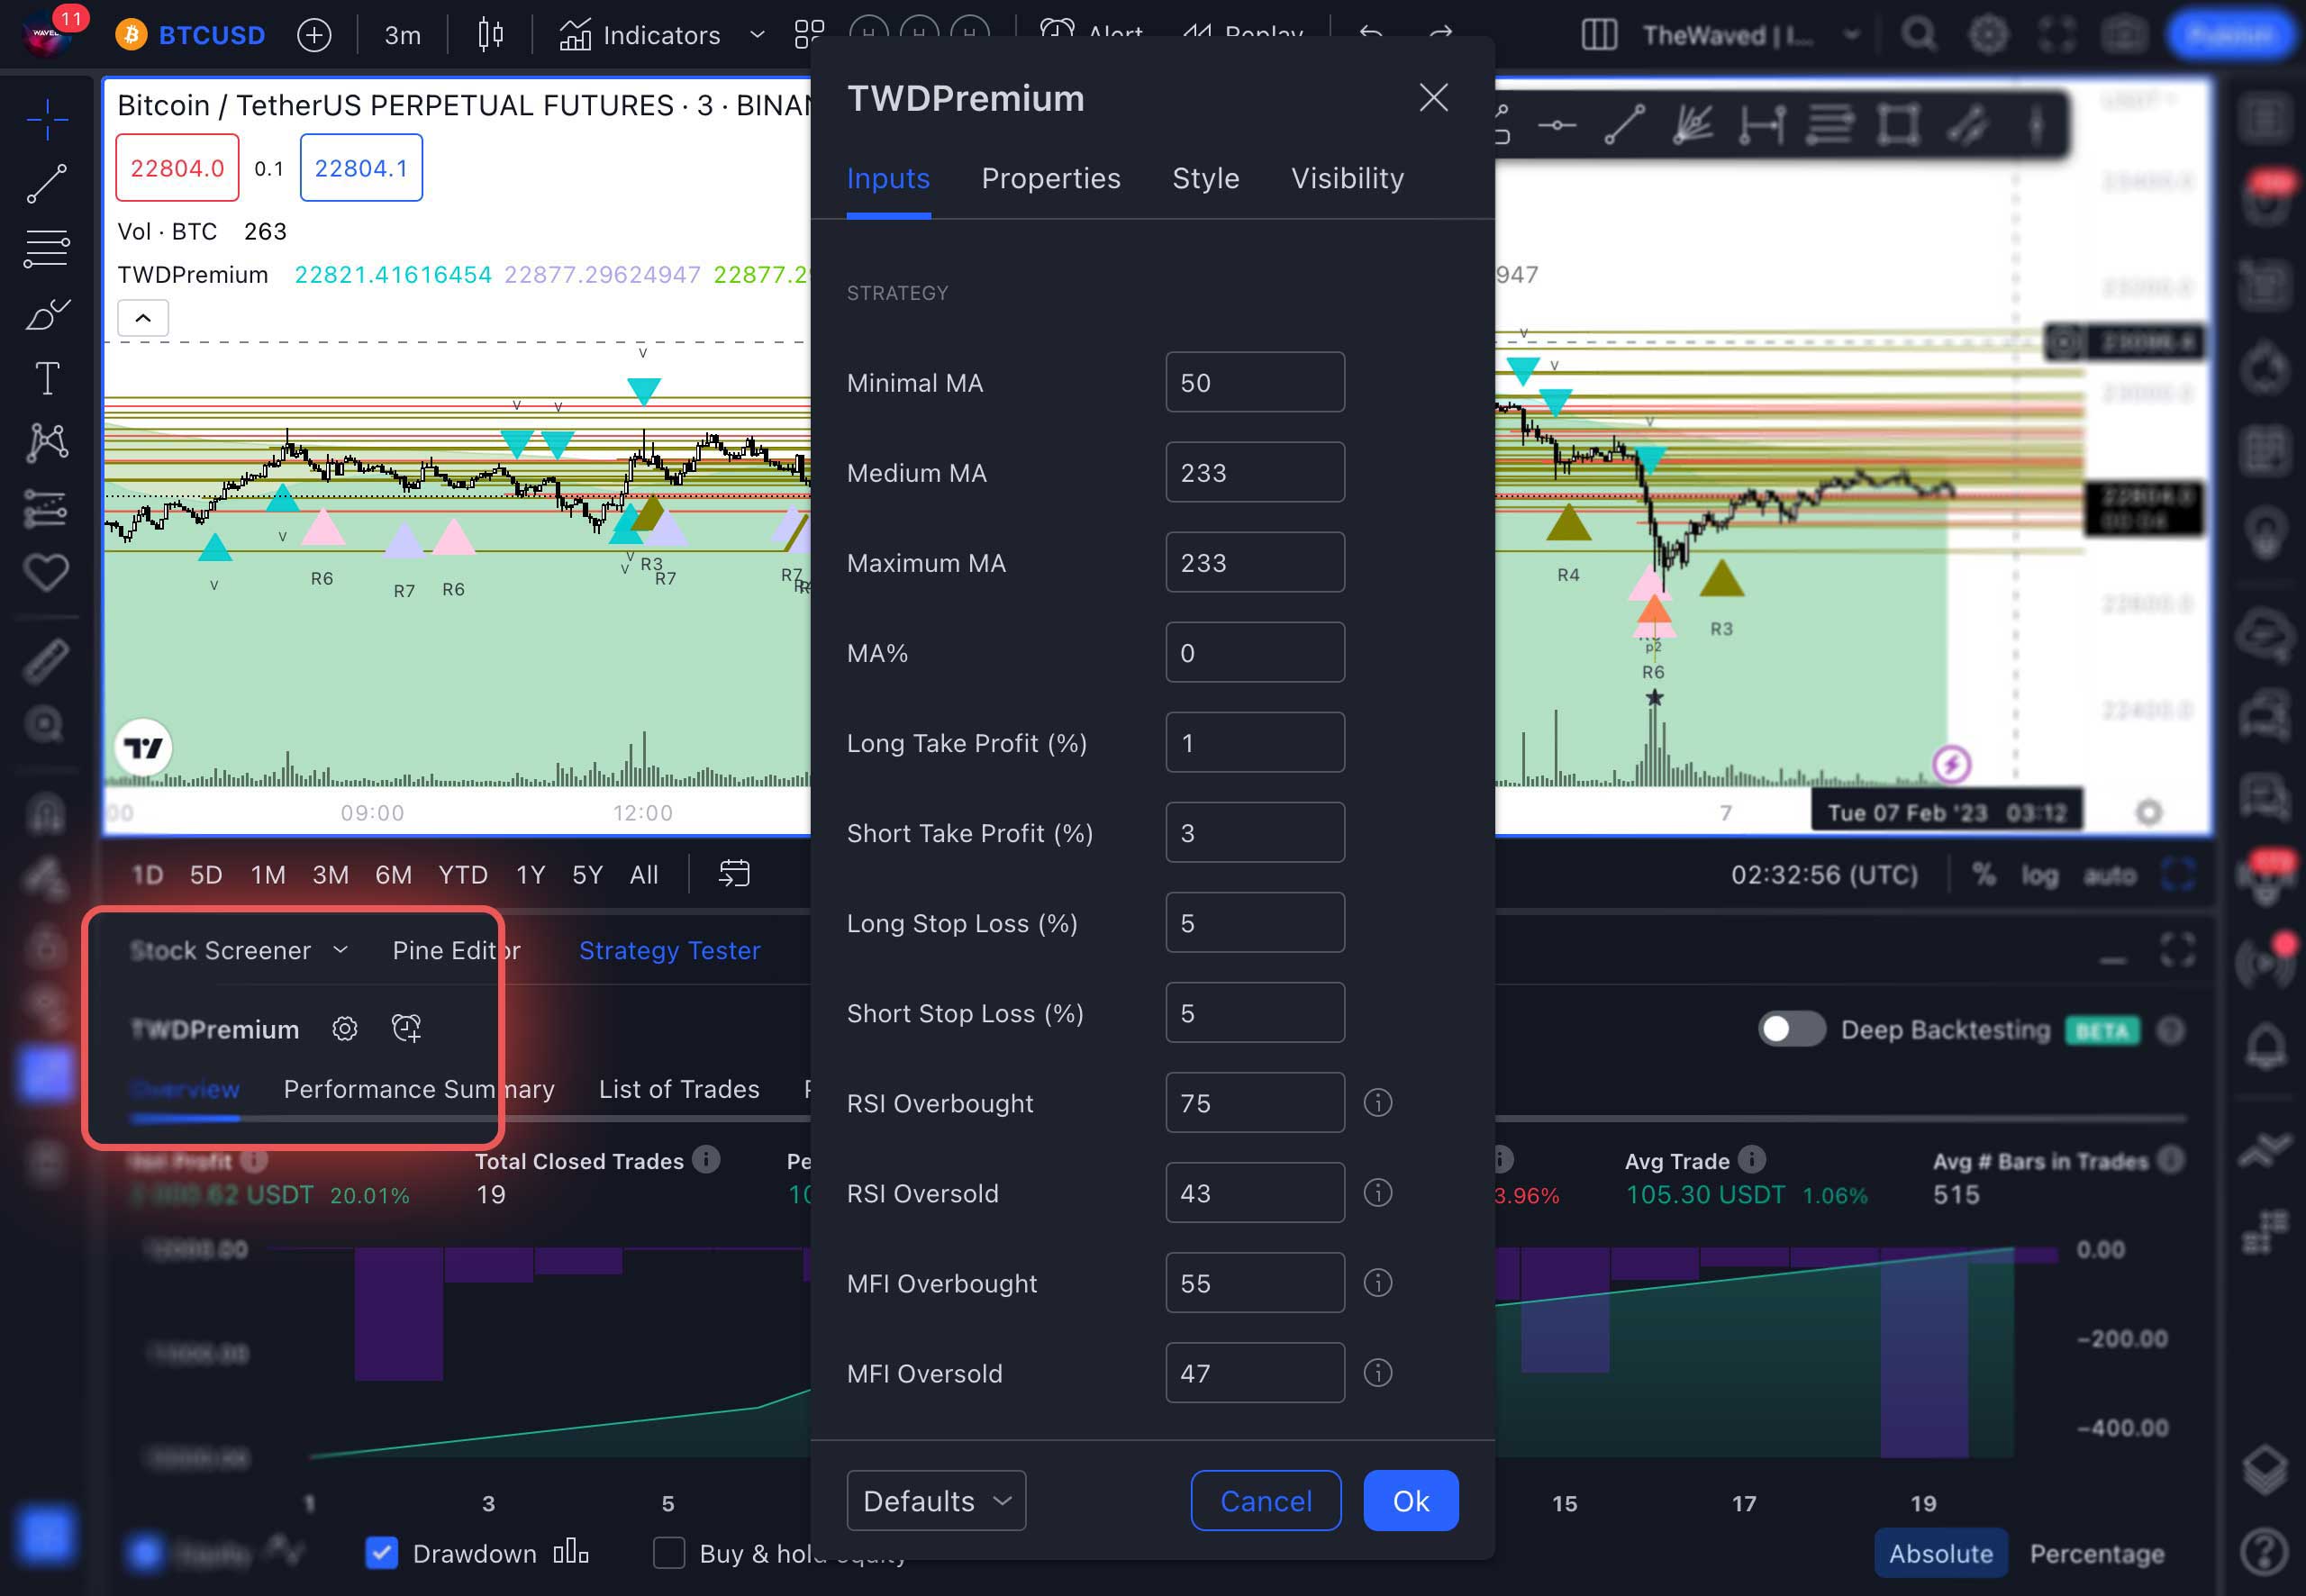
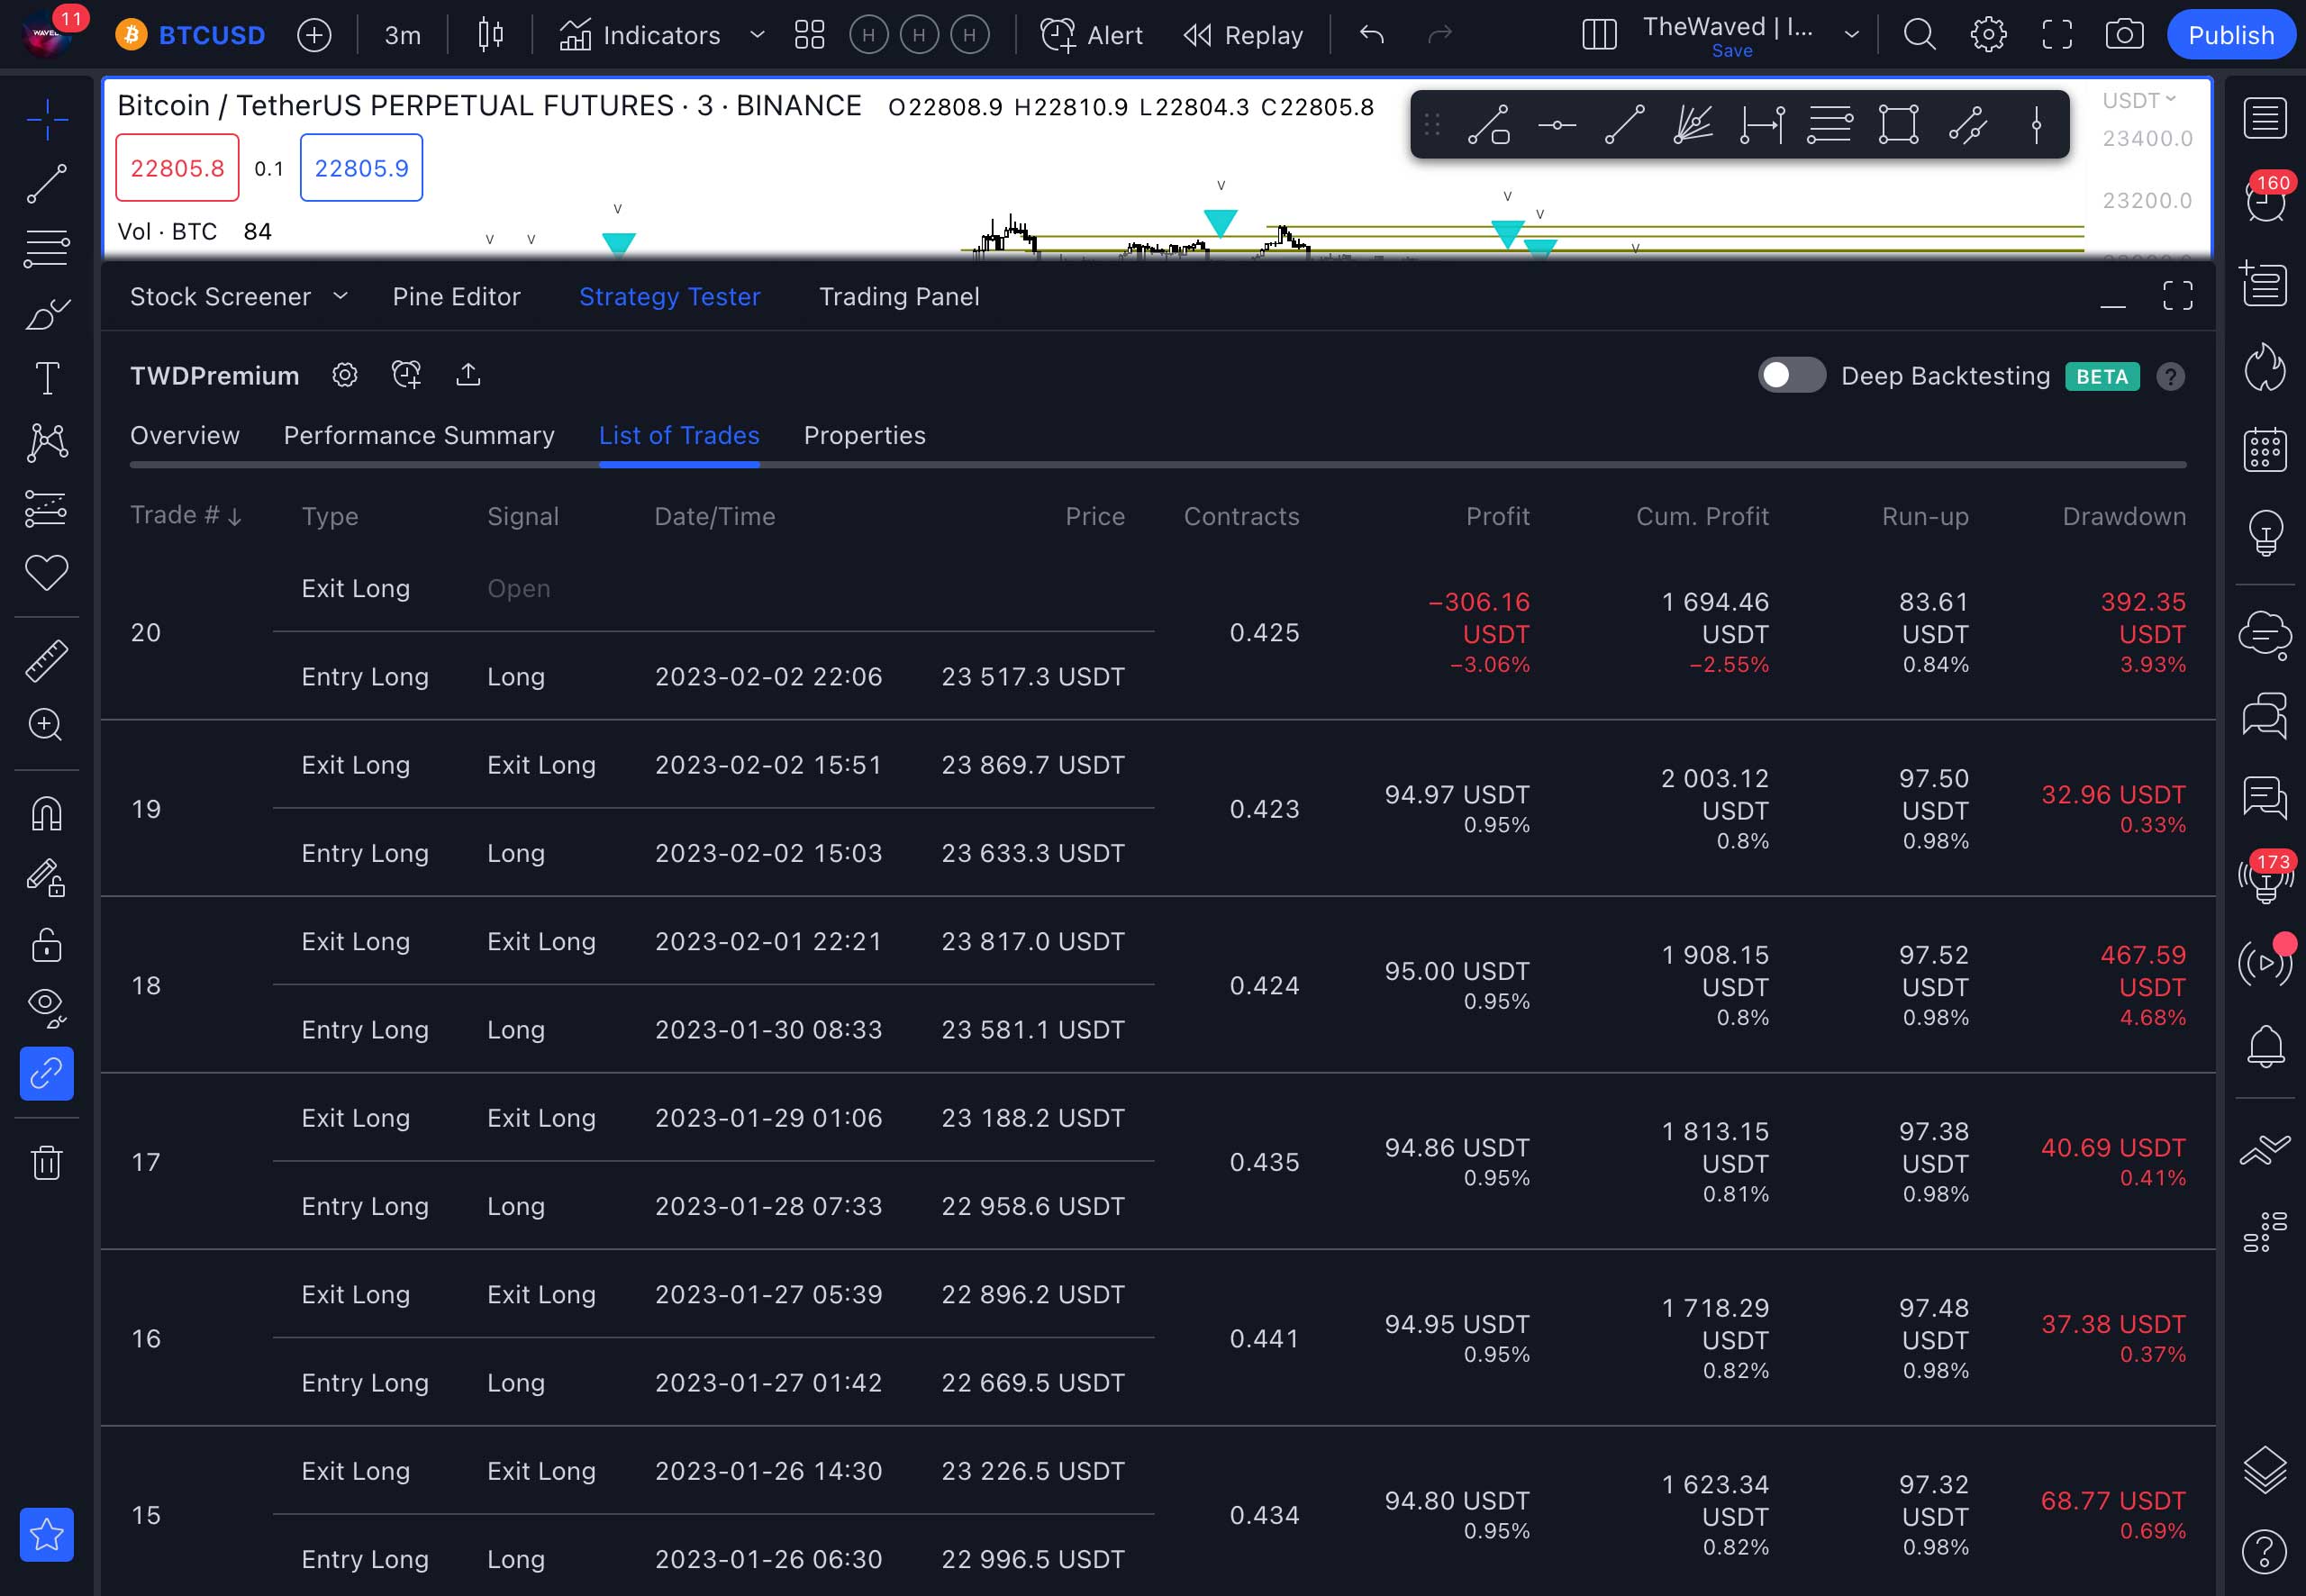
Example: Bitcoin / Tether Perpetual Contract | BTCUSDT | Binance | 3min
Trades Qty: 19 | 100% Profitable
Entry strategies and money management
Successful trading requires a money management strategy. That is, if you see a signal, it does not mean that you need to enter a trade to the full, so to say. Although the signals are accurate in more than 90% of cases, there is still a risk of error. This is why there are strategies for entering into trades that will allow you to save and increase your capital.
Of the many strategies available, we recommend you to use two of the most profitable and easiest ones, proven by traders from our team. Namely:
OPENING AND CLOSING TRADES BASED ON SIGNALS
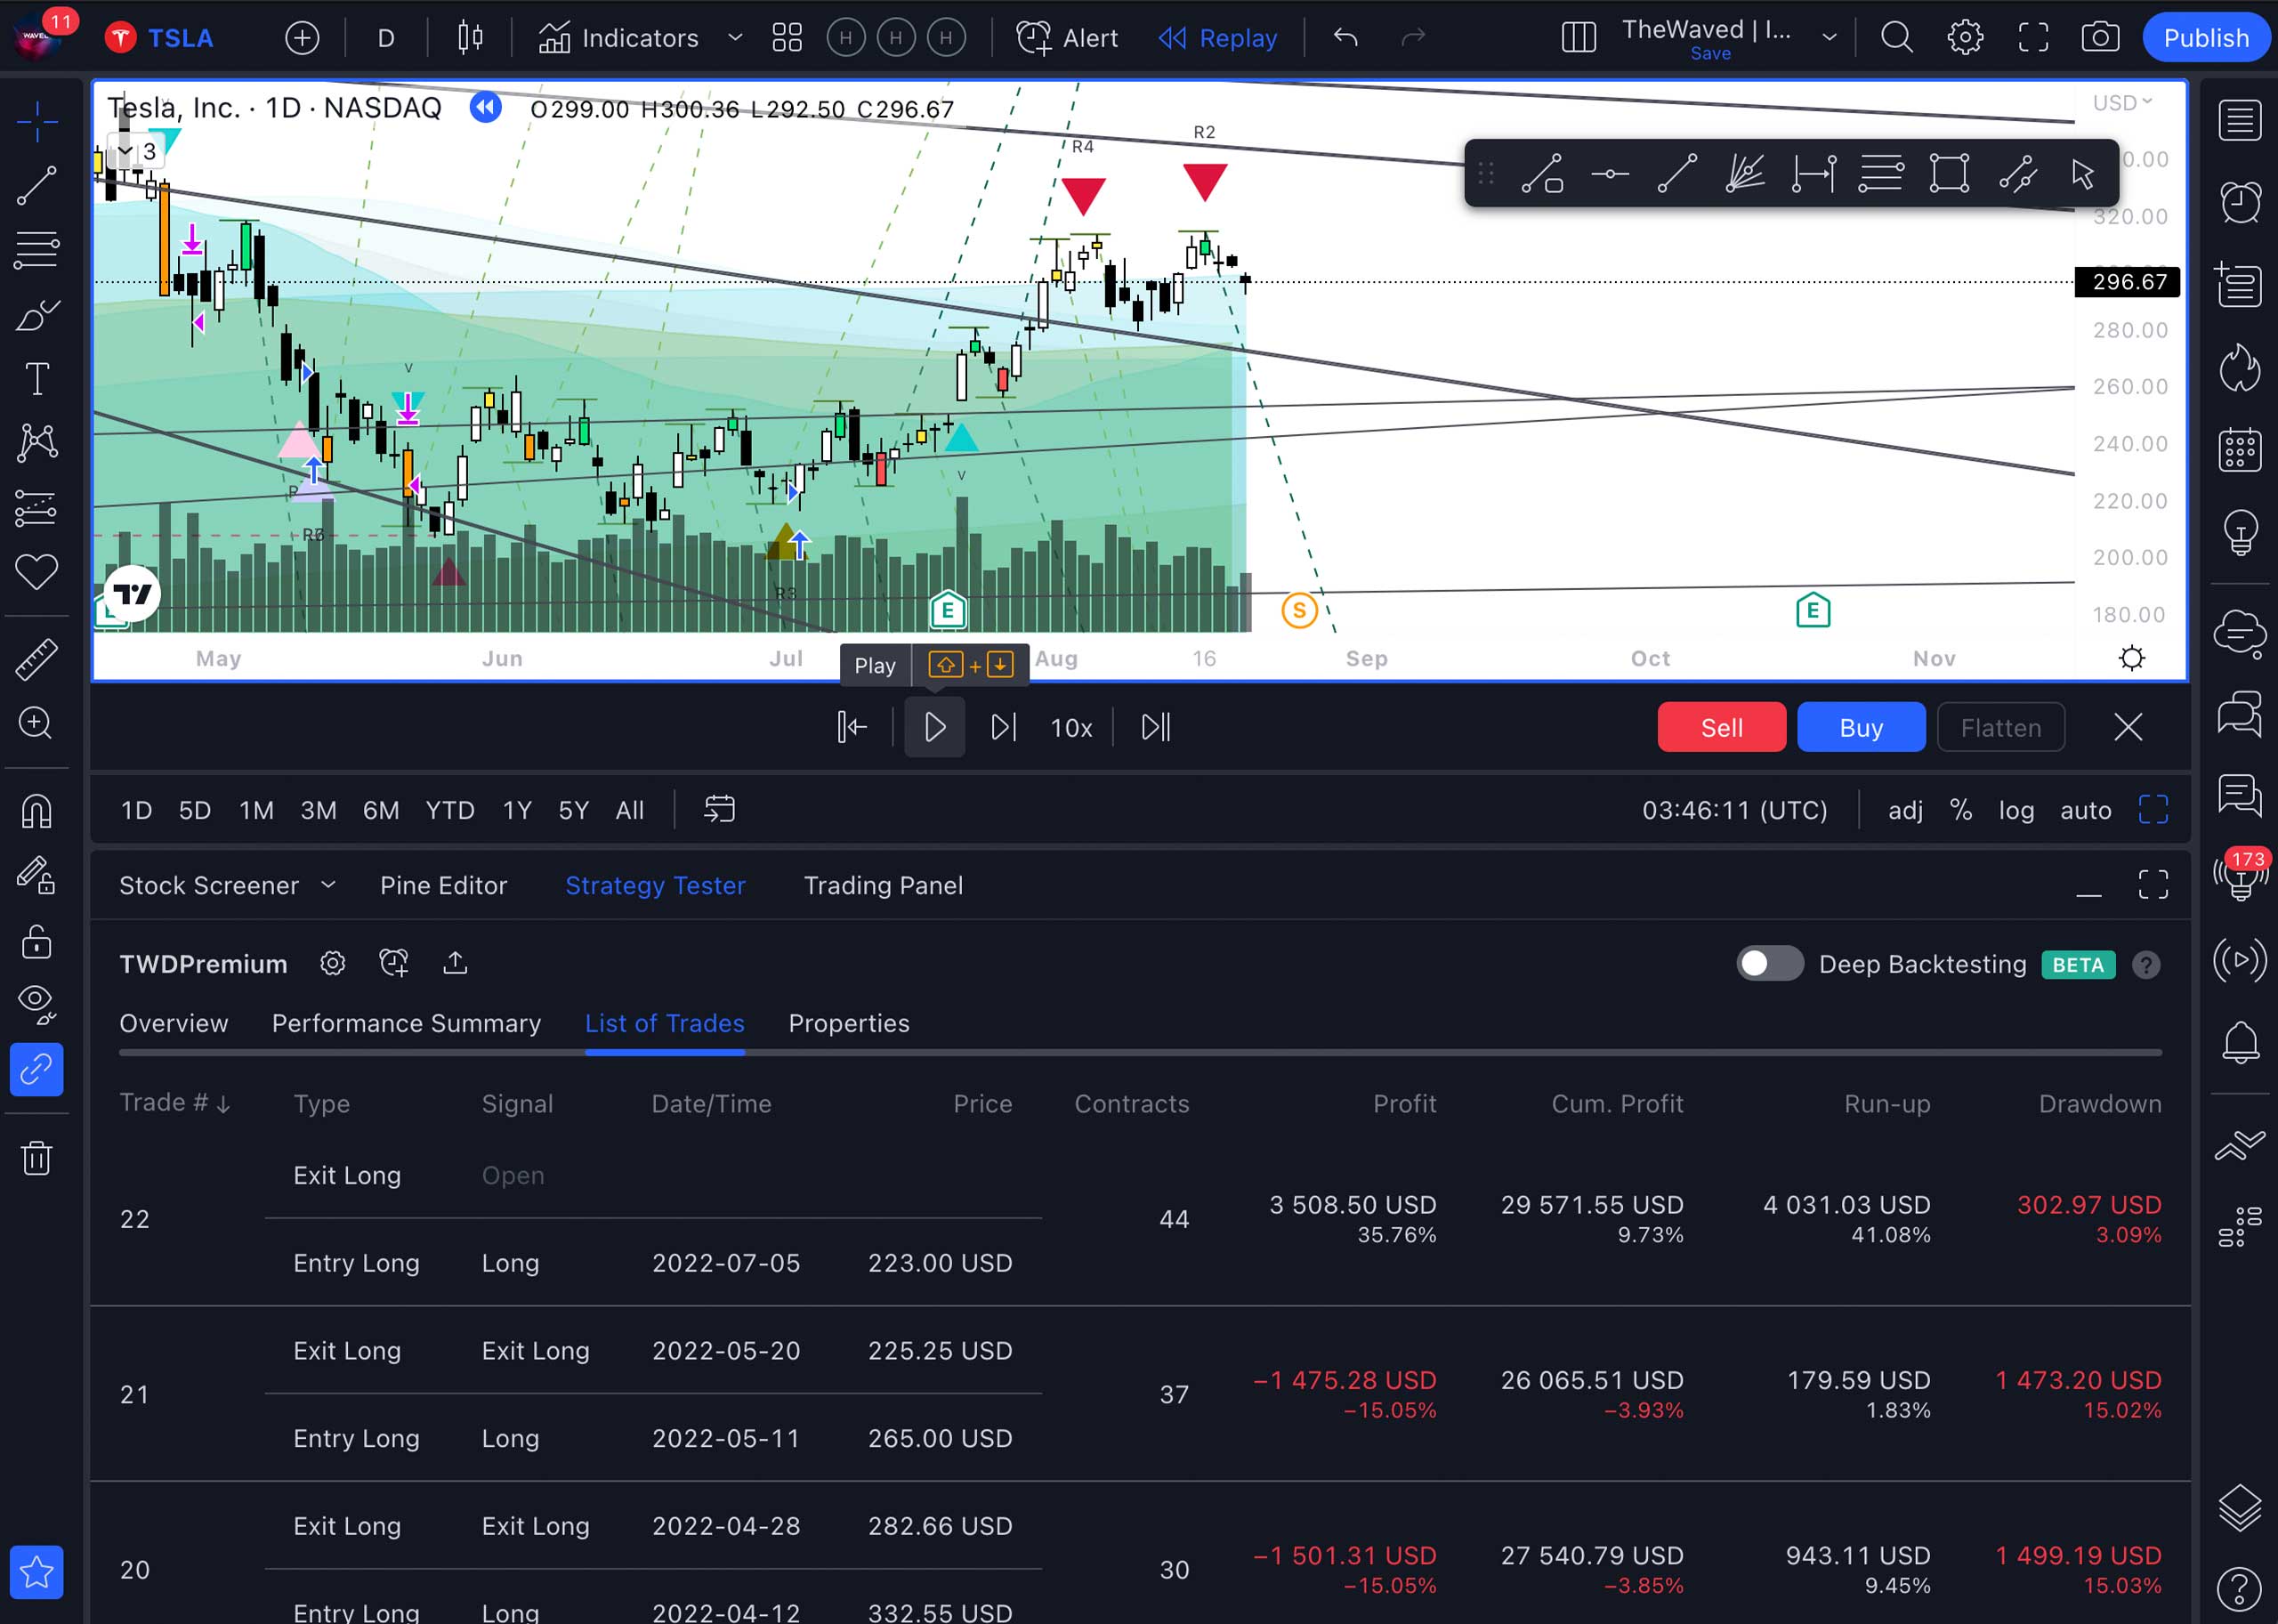
Everything is simple here: if you see a signal for entering (Long, Short), then enter the trade at the specified price. If you see an exit signal (Exit Long), then you sell the asset and make a profit. It is important to remember here that you should not allocate more than 10% of your entire investment capital to one asset.
With this approach, even if the price of one asset goes down strongly in spite of expectations, the other assets can compensate for the loss The only recommendation that should be followed for entering by signals is not to enter by the Bay signal if the Exit Long signal has just been given before it. Here you should wait until the asset price decreases, otherwise there is a high probability of drawdown.
The Exit Long signal is more important than Bay, as it is given when a lot of people exit with Stop. And Bay is given soon thereafter. That is, many people here are losing money, so you need to pay attention to it.
ENTERING THE POSITION IN PARTS
The essence of this approach is that you do not buy an asset immediately for the entire allocated amount, but buy it “in steps” using several consecutive signals. Thereby you average the position. It often happens that the price of an asset falls gradually and the Bay signal is given several times after exit with Stop during this period of time. Therefore, it is advisable to divide the planned amount, for example, into 4 equal parts.
You make the first purchase for ¼ of the planned amount, the second – for another ¼, and the third – for the remainder. Or buy ⅓ each time on a signal. This strategy is simple and the least “nerve-wracking.” We do not exit the trade with Stops and do not buy more if the price has jumped sharply up (in this case, we are already in the black).
For example, if you bought bitcoin for equal amounts for each of these signals: on the first signal at a price of $ 30,000, on the second – already at $ 23,600 and on the third at $ 17,000. Then the average purchase price would be about $23,500.
This strategy is used by professional traders, as it gives very good results. First: the purchase price of the asset in this case is favorable. Secondly: you don’t have to sit and wait for the bottom to buy, because no one knows exactly when the price will be the lowest anyway. Thirdly, a rebound can happen anytime and you can not only break even, but also get profit.
My first trade (Step-by-step instructions)
So, it’s time to try our indicator in action. To do this, you need to take a few simple steps.
In order for the appearance of your chart to match the training on the site, pre-configure the chart’s style. See FAQs for the instructions on how to do this.
OPENING A TRADINGVIEW ACCOUNT
-
Select the asset you want to trade with. For example, BTCUSDTPERP. This is a Bitcoin futures contract that is traded on the Binance crypto exchange. You can choose any other asset that you have access to trade.
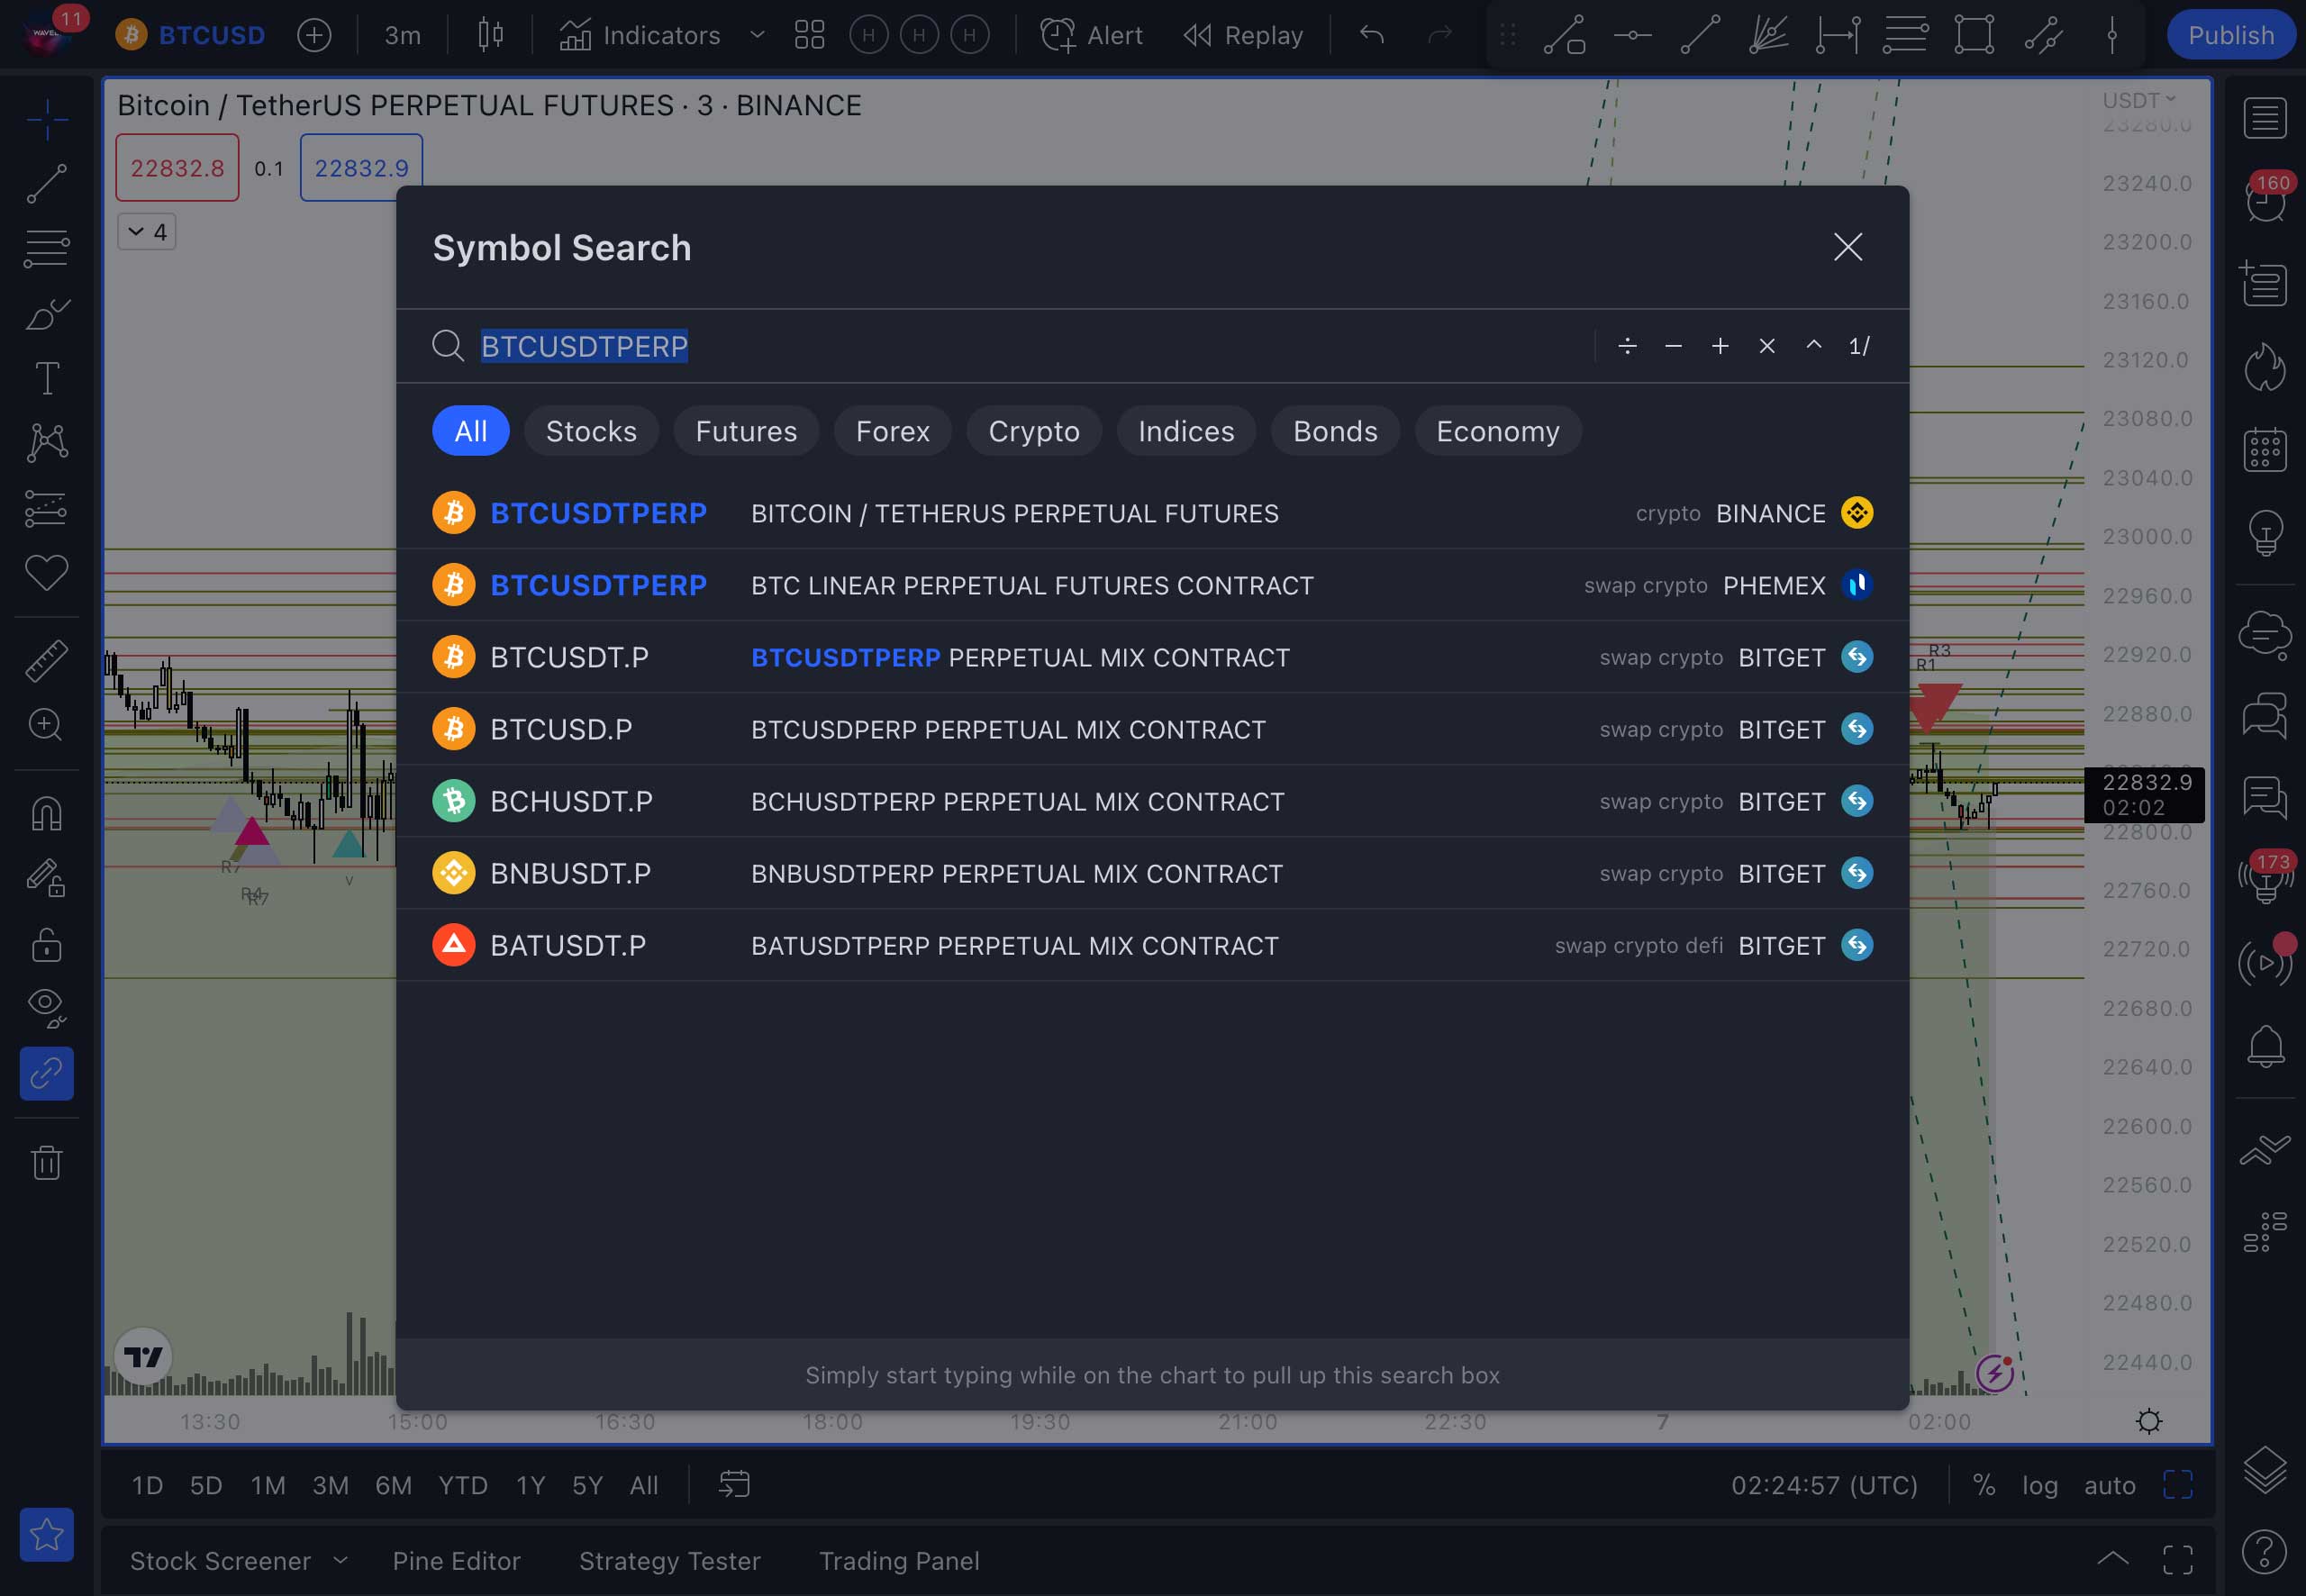
-
Add an indicator to the chart. To do this, select it from the list available in the indicator panel.
-
Select a timeframe from the list of available ones. For example: 3 minutes. (The three-minute timeframe is only available in paid versions of Tradingview). We are using this option to show in detail the process of trading.
-
Set up a strategy based on the example. The settings are available only in the Master and Premium versions. If you have the Pro version, skip this step.
-
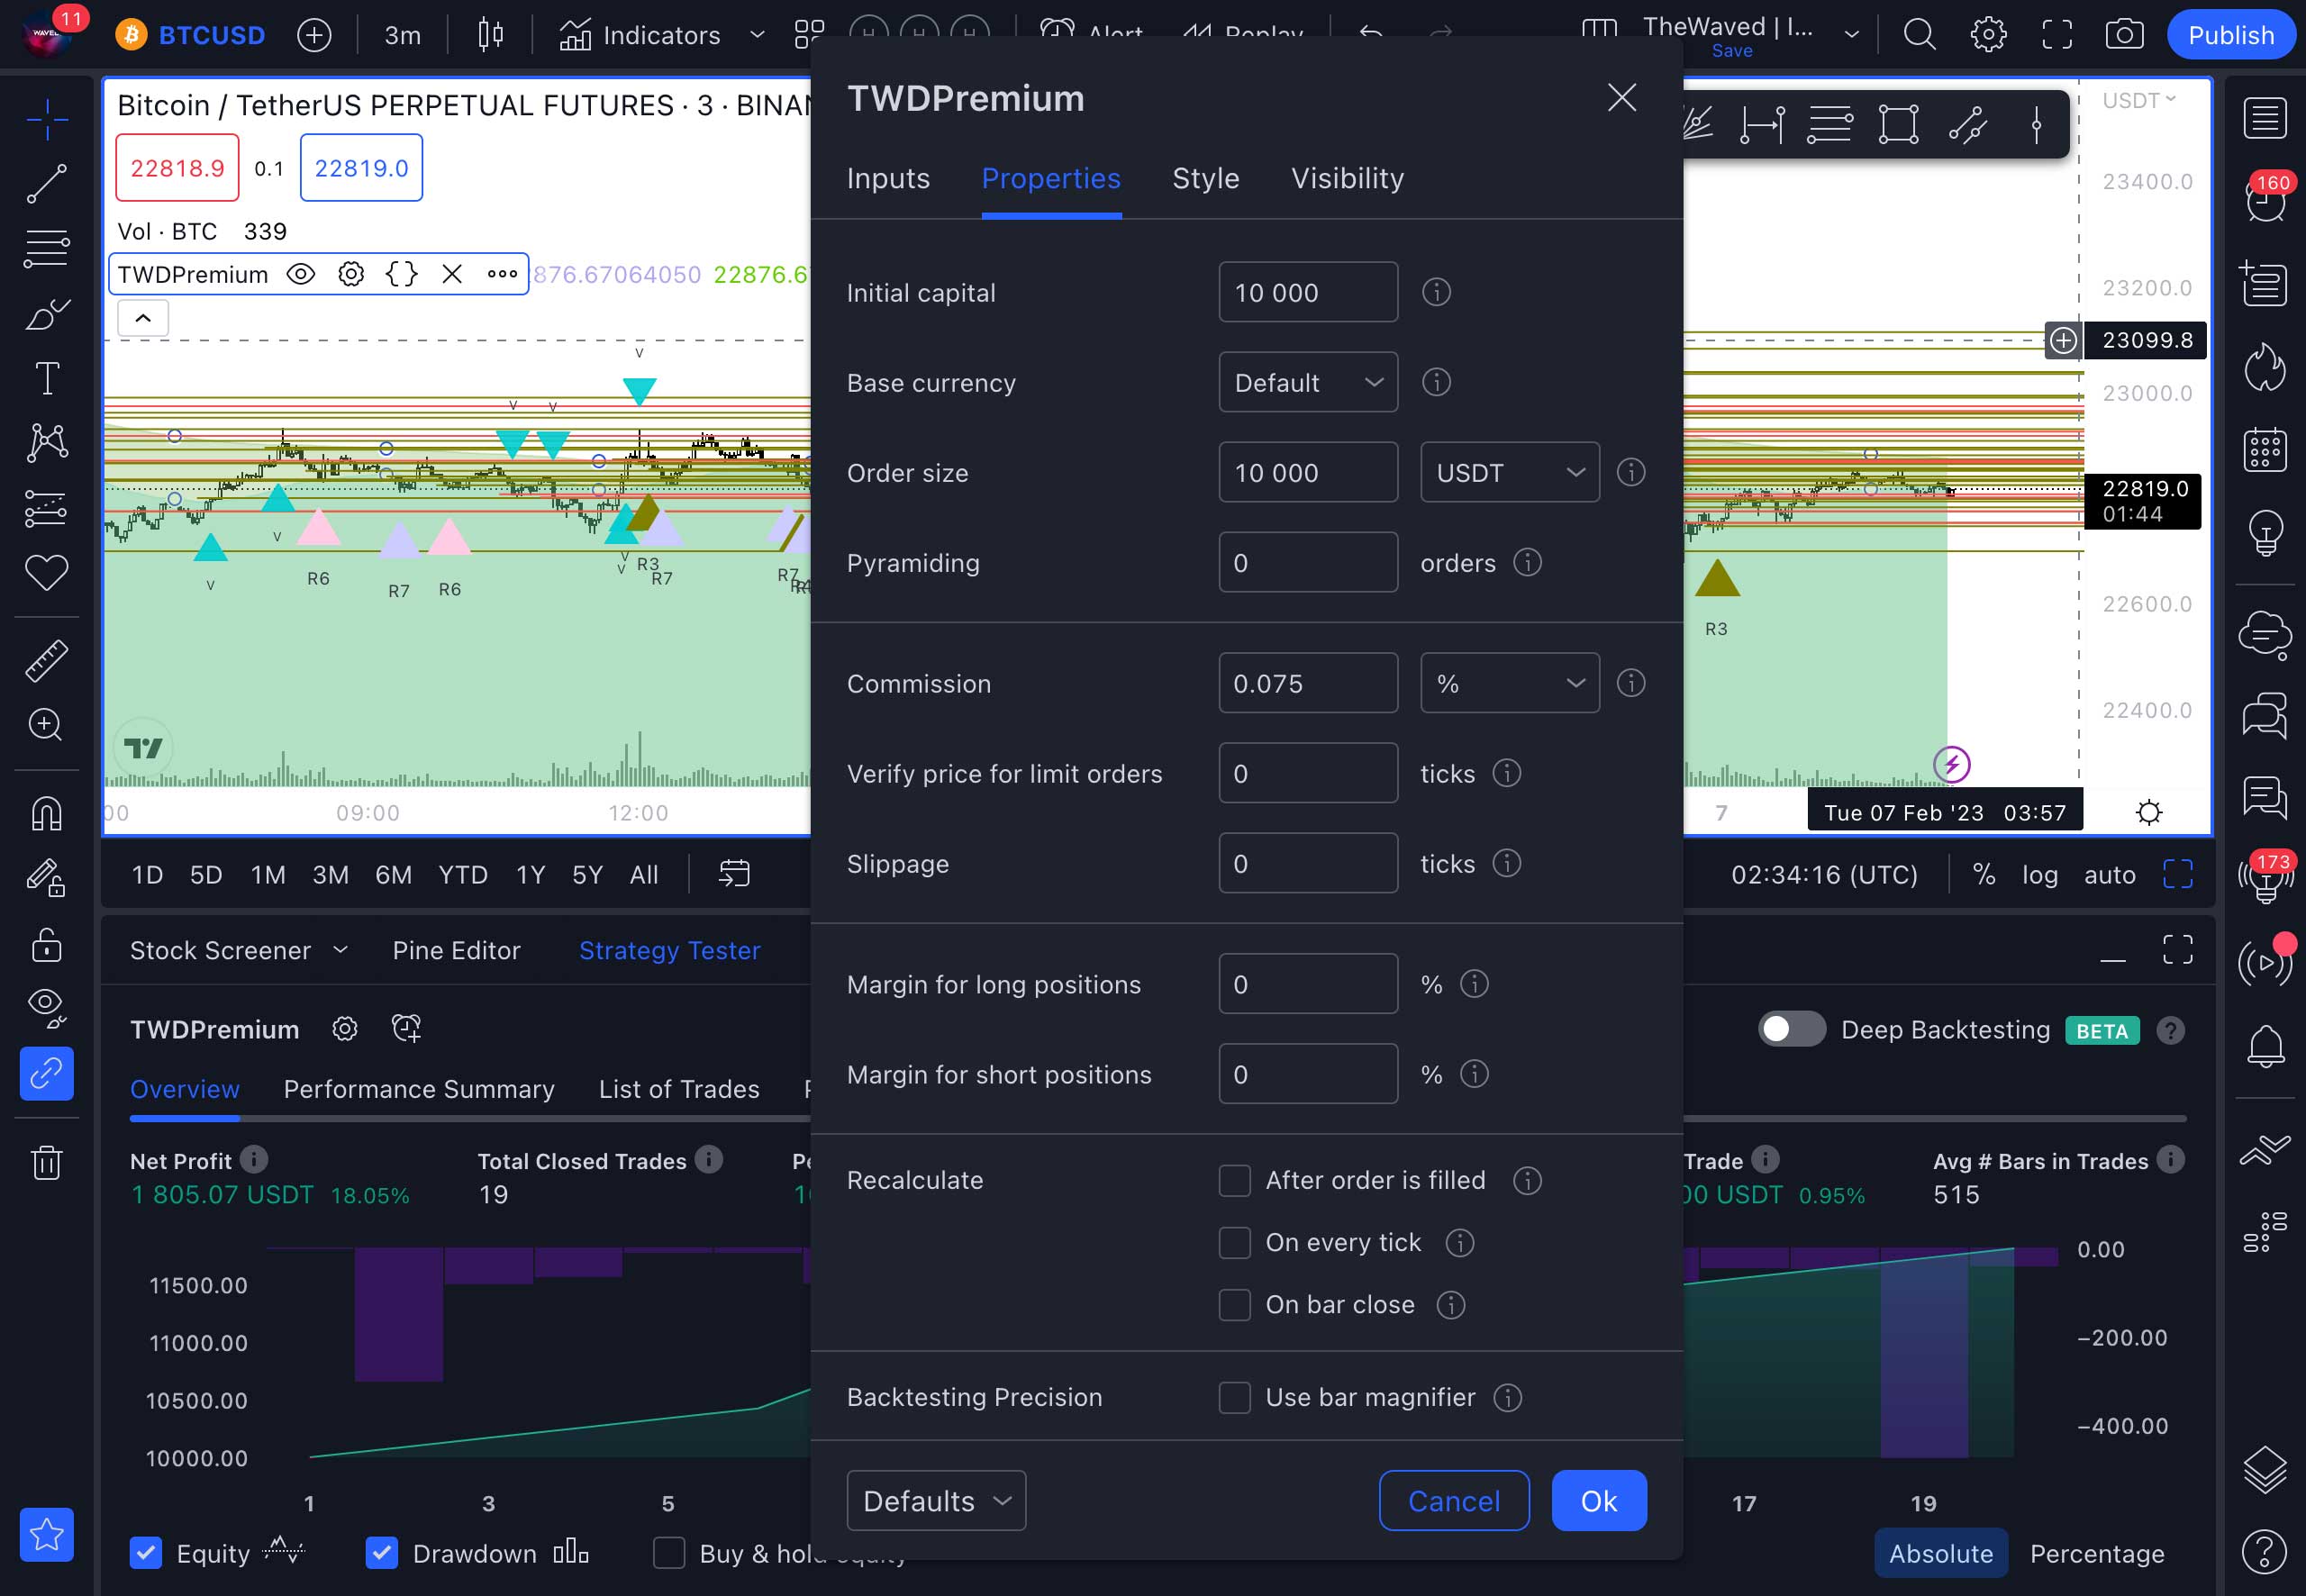
Adjust the commission percentage according to your broker.
-
Adjust the style of the indicator and signals.
-
After applying the strategy settings, you can view the list of trades in the List of Trades section.
-
Create a strategy alert by clicking on the plus button in the Strategy Tester panel. You can enter the name of your strategy by adding it to the Alert Name field.
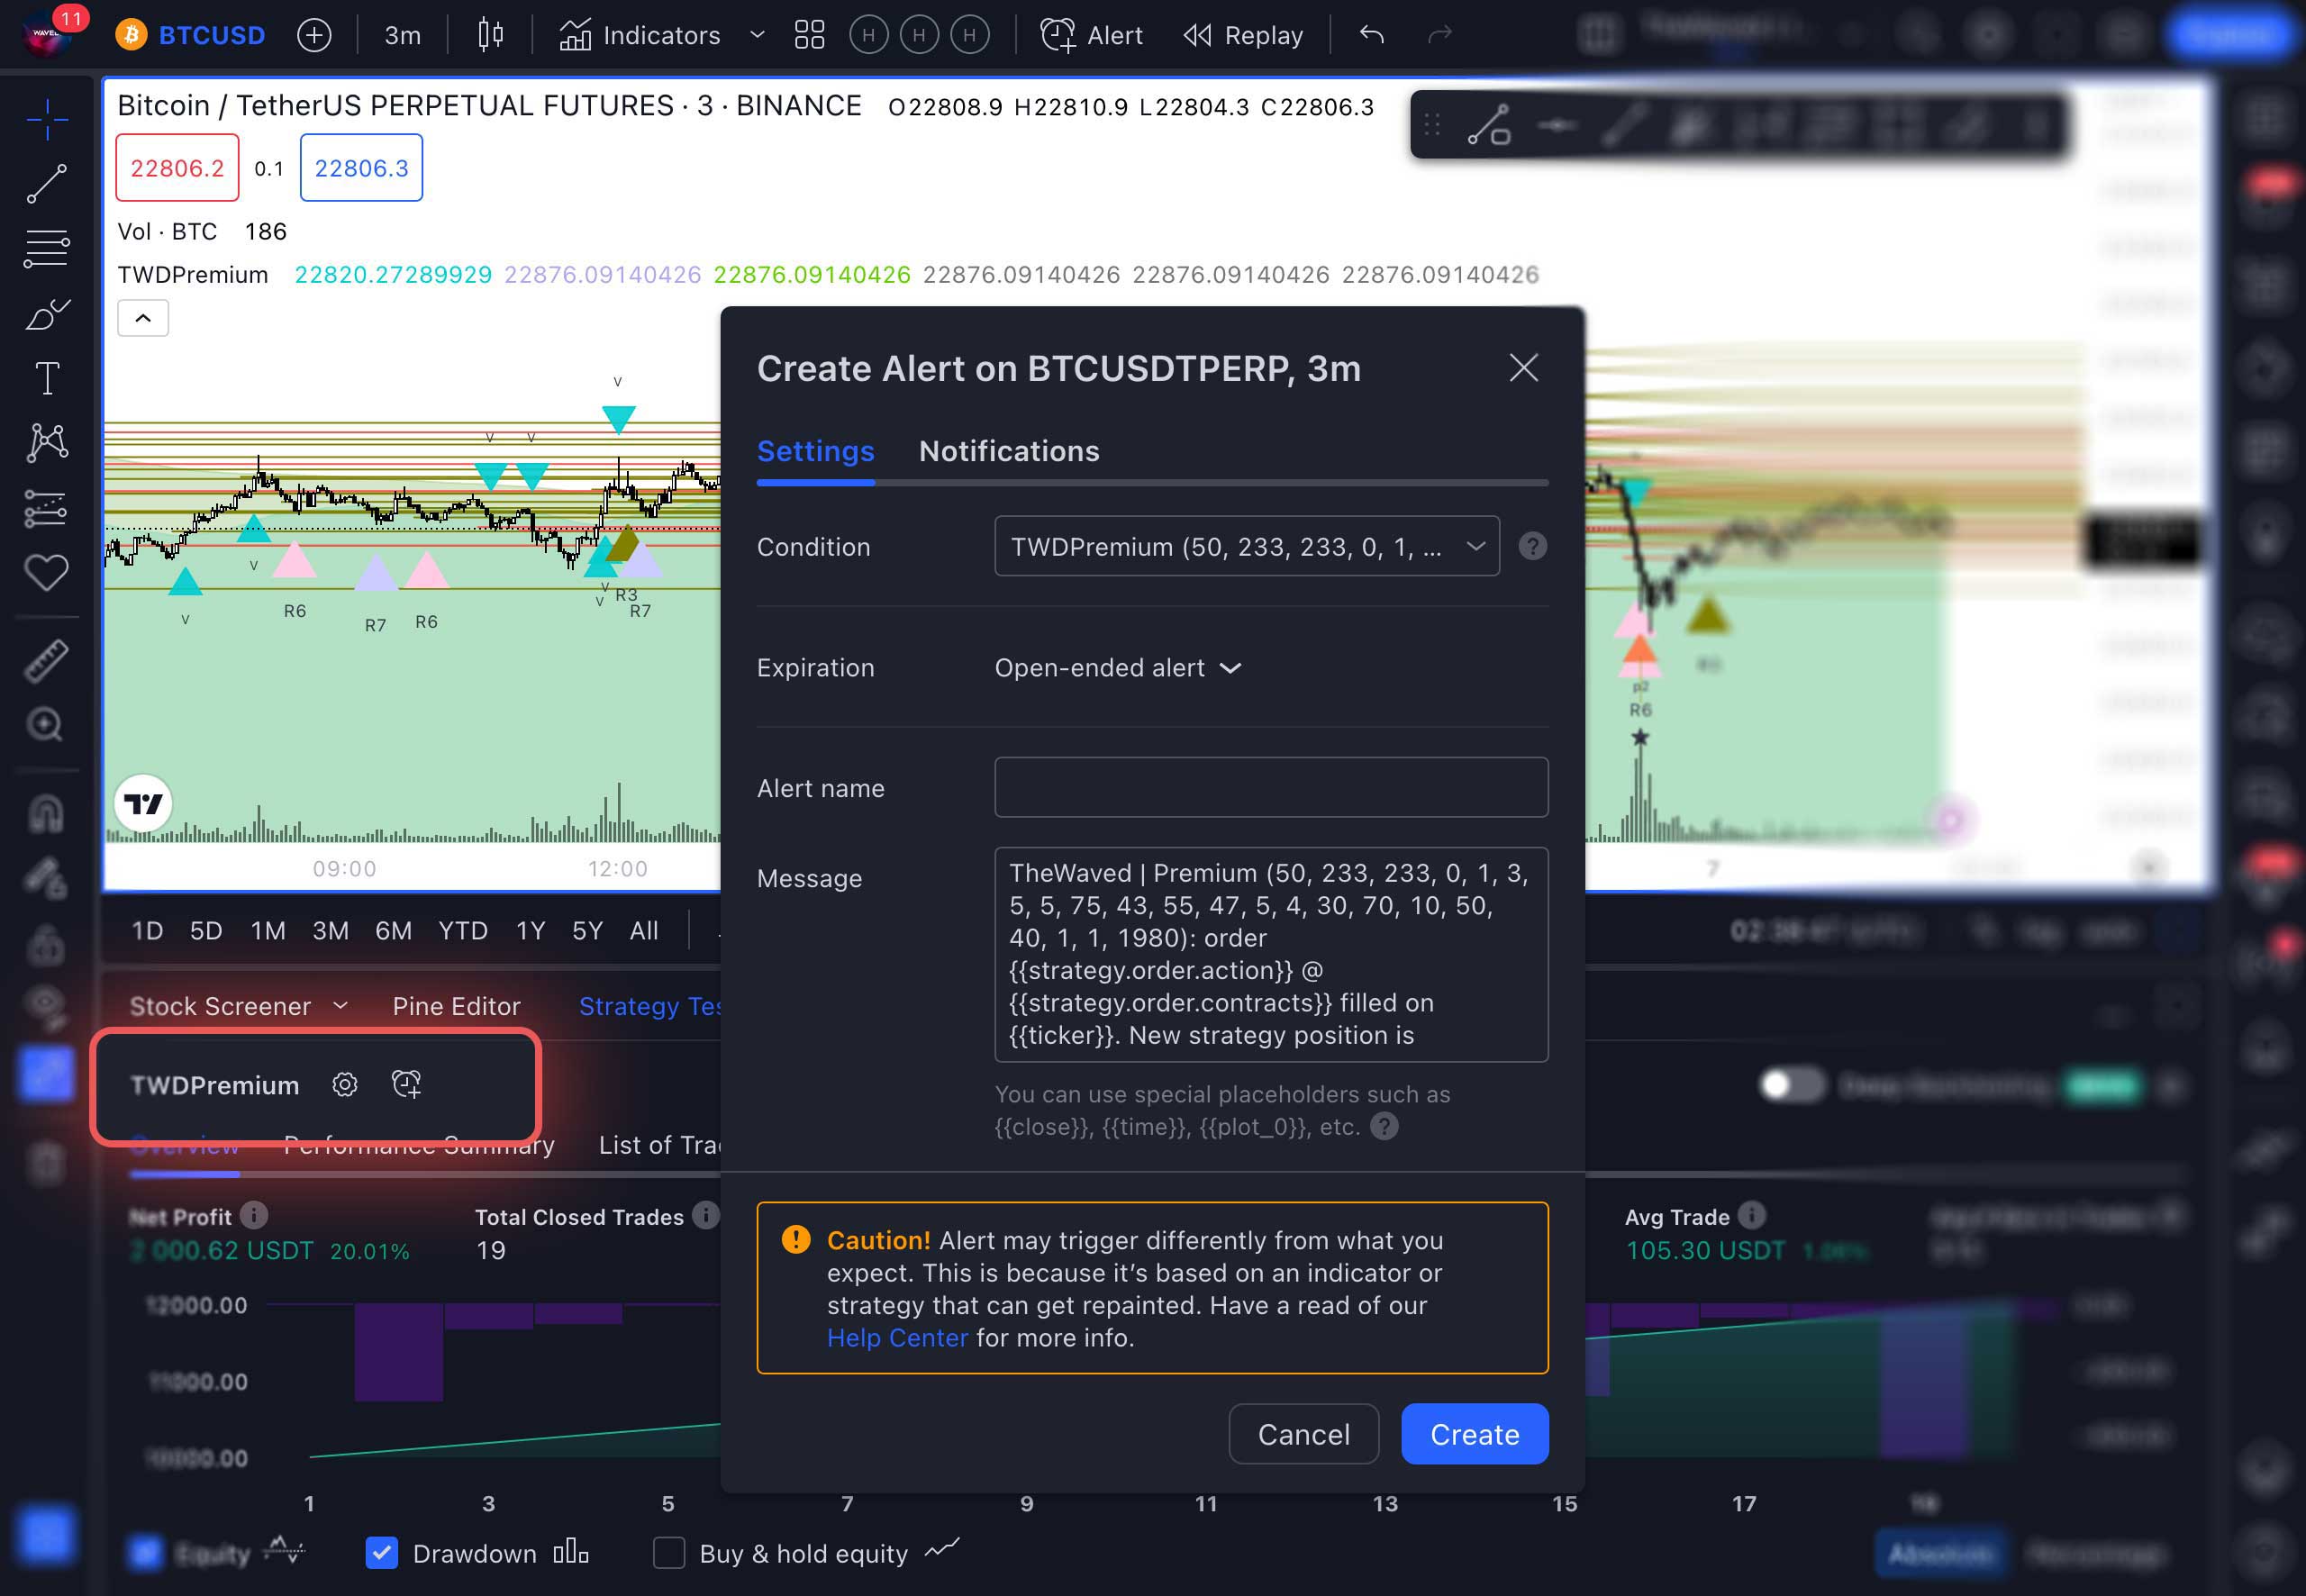
Attention: the message about redrawing signals is given only relative to VSA patterns, because they are formed at the time of pattern creation. If the pattern is not formed when the candle closes, the signal will not be sent, even if it was formed before the candle closed. This does not affect the strategy in any way and does not create false signals. -
In the signal notification settings, select any convenient ways for you to receive a signal. The fastest way are messages in the app and opening of the Pop-up modal window on the terminal screen.
-
You can see the added signals in the signal panel by clicking the second icon at the top in the side right panel. You will see all the signals you have already received in the Alerts Log section, below the added signals.
-
Connect your account at Binance or another available broker. If your broker is not in the list, then you can only trade from your broker’s account in manual mode. You can read more about connecting a Binance account in a separate section above.
-
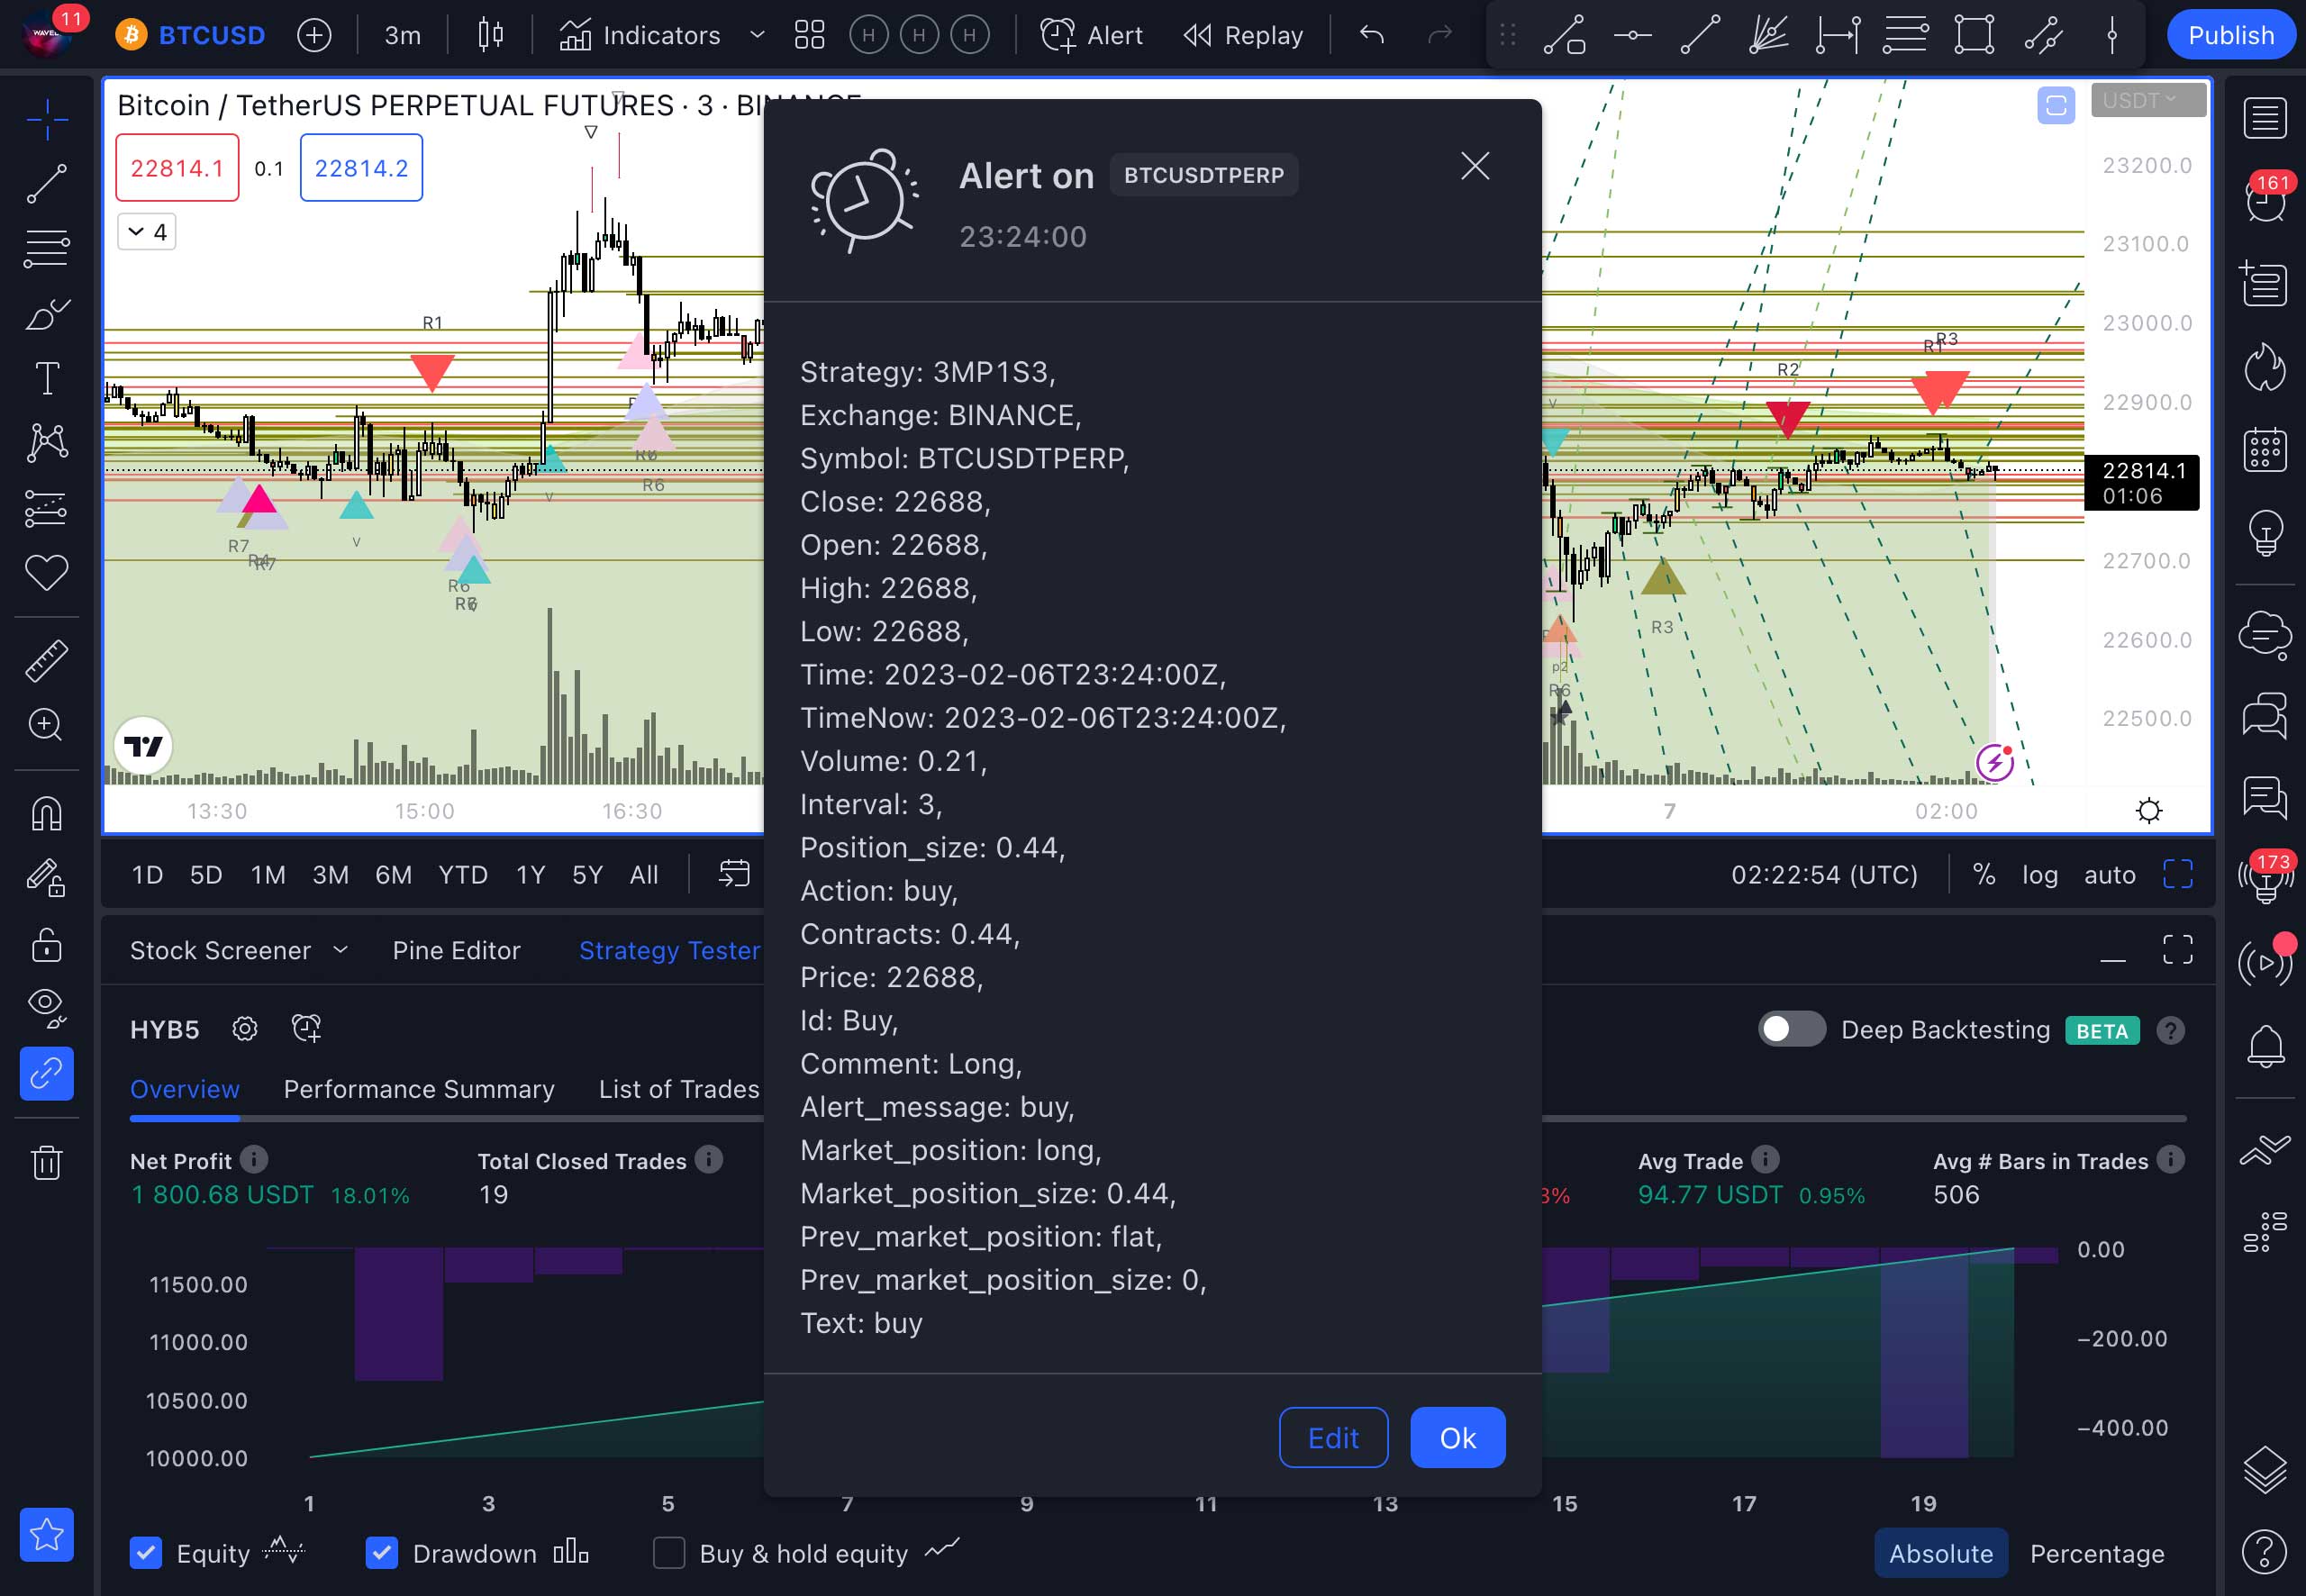
Once you receive a signal, you will get a similar message with the name of the asset and the name of the strategy. Take action!
-
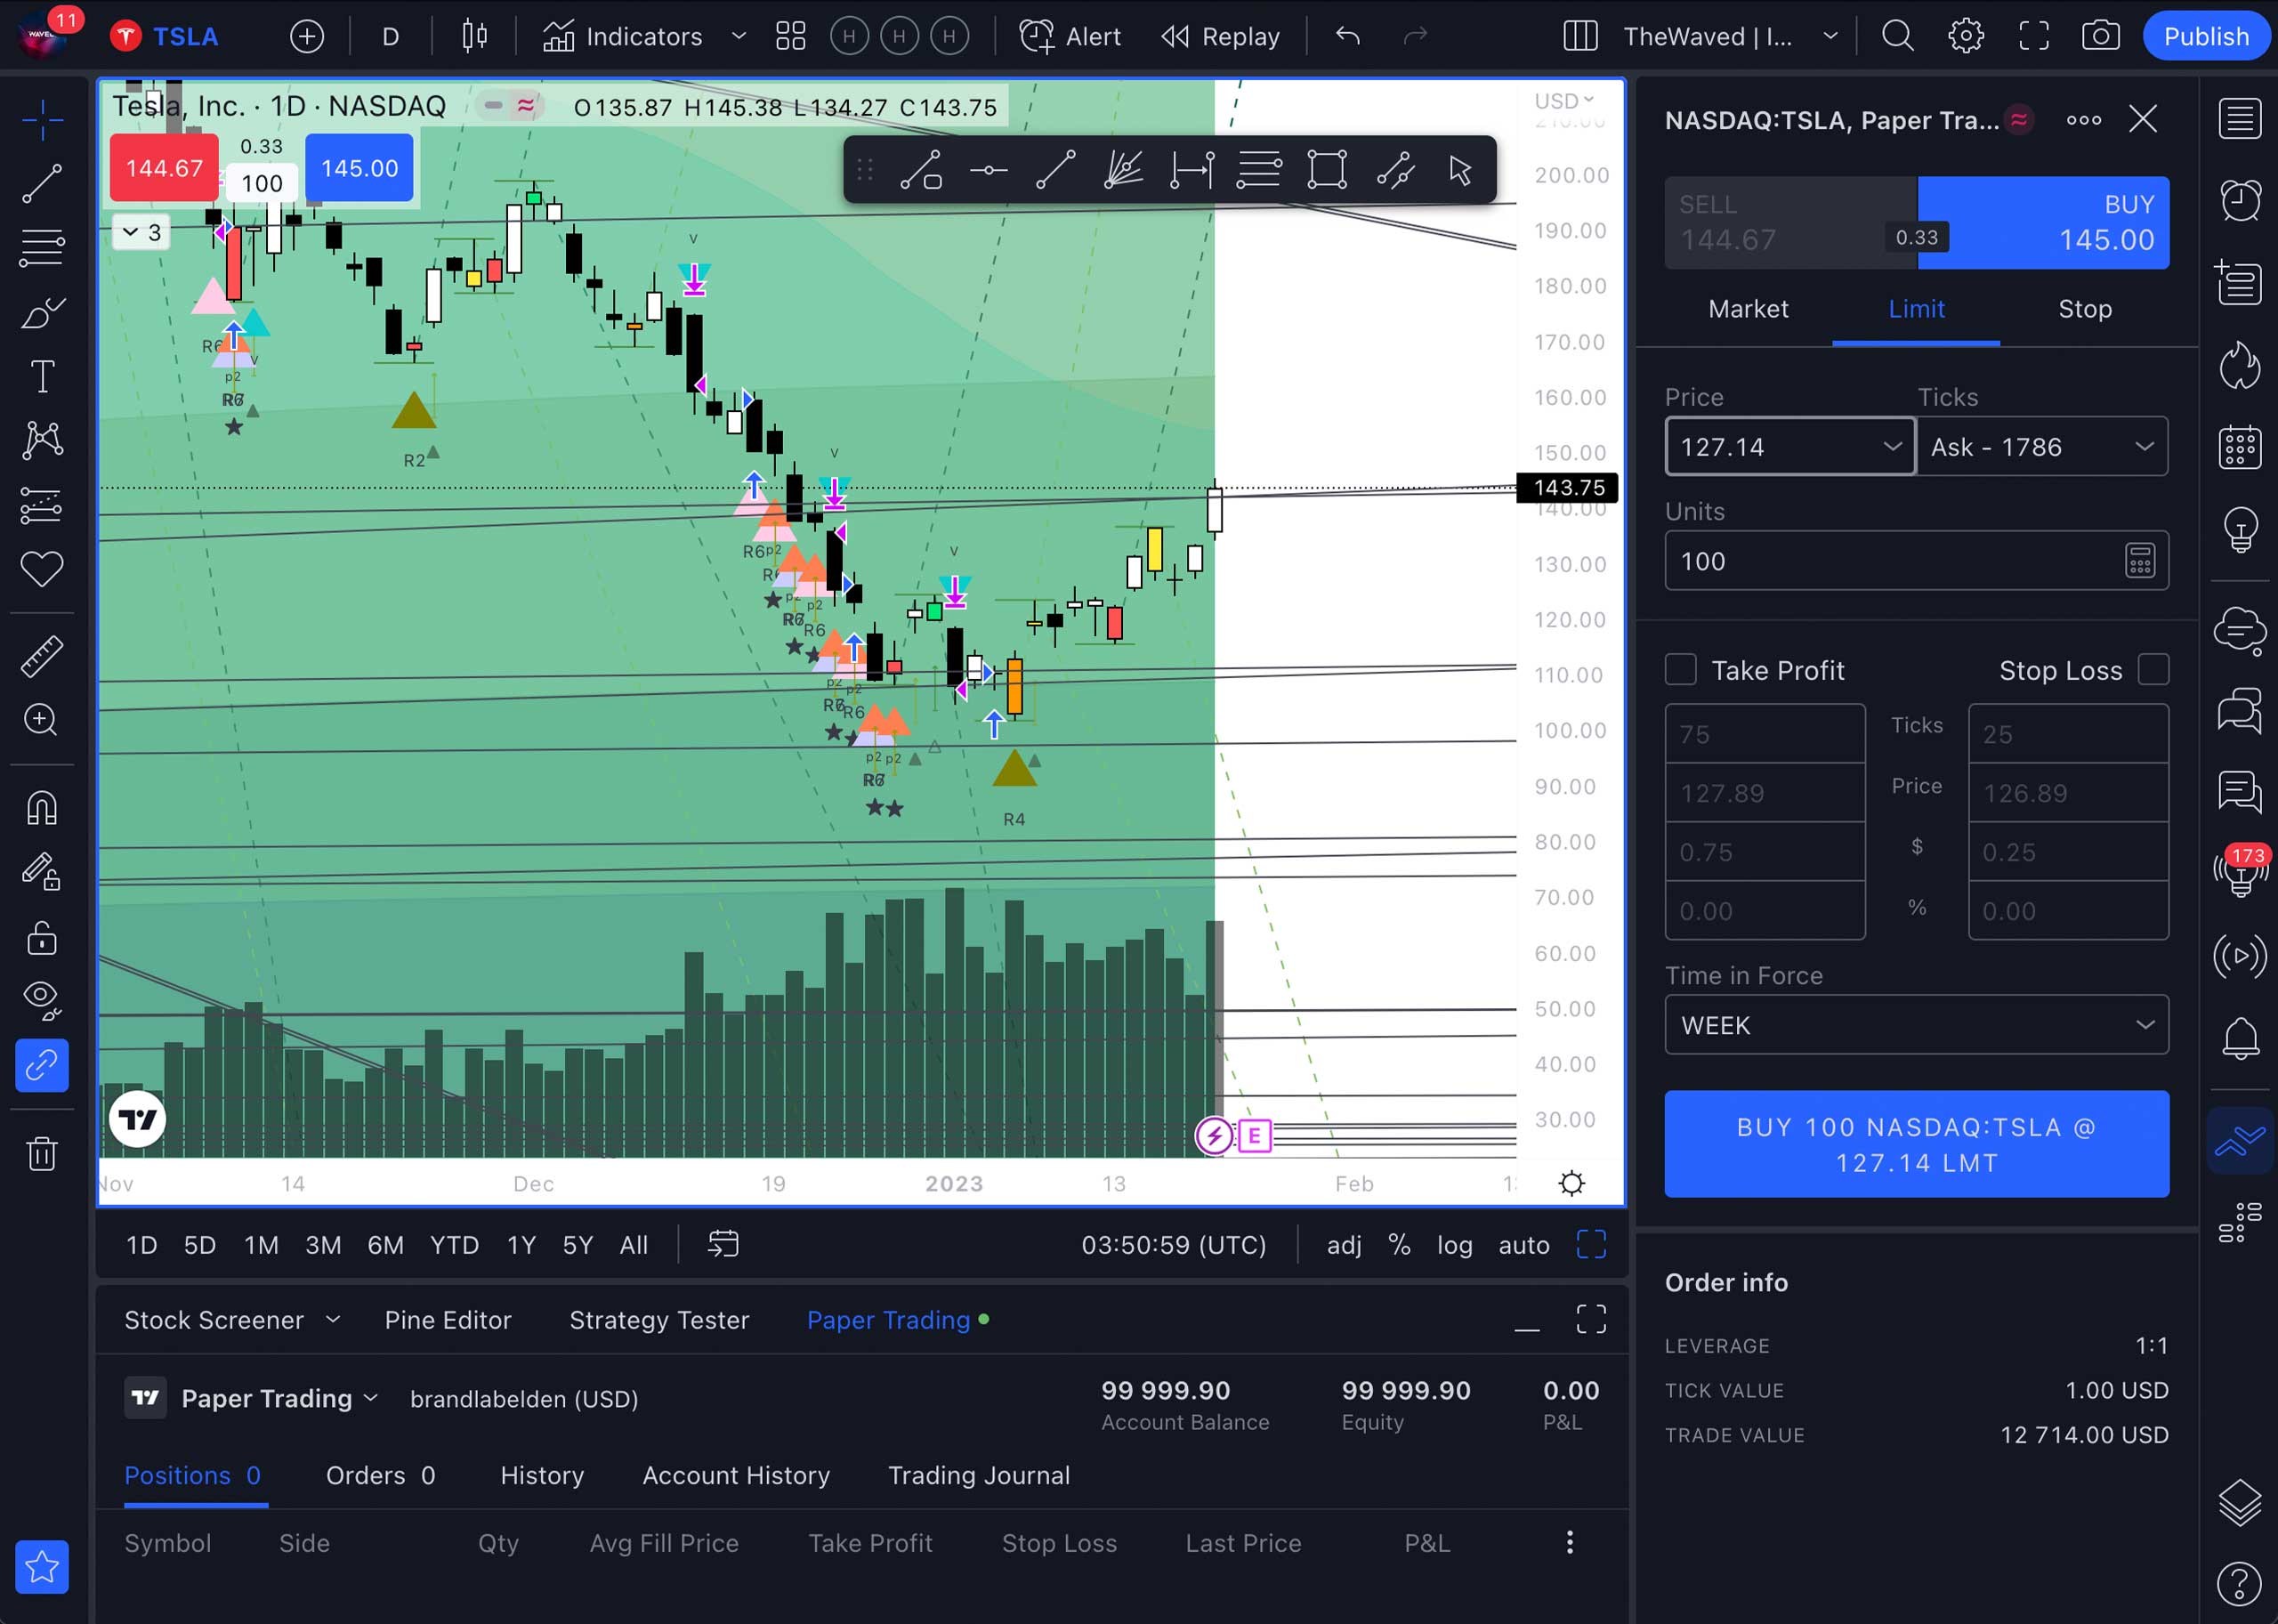
Open the trading panel and make a trade. In the pop-up window, enter the number of units of the asset you want to buy. Also, here you can set the Stop Loss and Take Profit settings if you want to take profits or avoid losses at a certain price.
Done! Now you need to wait for the next signal to close the position. Or you can exit the trade at the moment when you are satisfied with the profit you have received. You can learn more about trading in the Tradingview terminal in the service manual.
Features
This section contains descriptions of all the functions and features of the indicator.
The indicator’s core
The Waved Indicator combines the most popular and accurate methods of market analysis, including unique ones that have no analogues. That is why it works equally well in all markets. Below you can learn in detail about the methods that underlie it.
VSA analysis
VSA – volume and spread analysis; the indicator is based on the dependence of the difference between the price of an asset at the opening and closing of a candle (spread) on the trading volume. It implements the “effort – result” principle. Where the effort is the number of closed orders or volume, and the result is the size and shape of the bar.
Unlike other indicators and types of technical analysis, VSA allows analyzing how major market players behave and see their intentions. “Smart money” can manipulate the market in its own interests, and VSA makes it possible to predict further development of the situation.
There are many VSA patterns, such as Rising Market, Bad Holding, Test of breakout, Breakout, Absorption, and many others. Each of them is formed as a result of certain actions of the major players and gives an indication of their intentions.
For example, the Rising Market pattern or “the end of a growing market” shows us that despite the positive news and seemingly positive dynamics with high volumes, the spread is small. And this, in turn, leads to a rapid fall in the rate of the asset. At such moments, a lot of long positions opened in the wake of good news, are liquidated with Stops.
The Bad Holding pattern illustrates the opposite situation. Against the background of bad news, the asset price is falling, while the trading volume is large and the spread is narrow. Small players, seeing all this, put positions in shorts, but they are liquidated on the next bar.
And these are just two of the many patterns that exist in VSA analysis. To learn how to see them and understand them, you will have to spend a lot of time, effort, and also money. Mastering this method costs about $ 1000.
But the good news is that all the patterns you need have already been taken into account in The Waved Indicator! Moreover, the indicator also applies non-standard patterns that cannot be found in the books on technical analysis. They are derived from the analysis of hundreds of thousands of charts of financial instruments by a neural network. And their accuracy can be seen on any chart you choose.
VSA signals in the indicator are specific situations that can occur on all timeframes without exception. The larger the timeframe – the more powerful the signal, but also the higher the price will go. It is best to focus on them starting with a 3-hour timeframe. Although, you can see how they work even on a minute timeframe.
Candlestick Pattern Analysis
As a visual element of the chart, candlestick displays the price of an asset on a given timeframe. And candlestick patterns are historically established patterns of the location of certain types of candles that can indicate a predicted price change.
The key word here is “can.” Since candlestick patterns prove to be correct in only 50% of cases. Therefore, in our indicator, we do not use a standard analysis of candlestick combinations, but combine it with many other types of analysis. Thanks to this, the maximum accuracy of the signals is achieved.
Technical Indicators Analysis
RSI or relative strength index is an indicator that determines the strength of a trend and the possibility of its change. It shows who dominates the market: buyers or sellers and whether their mood is bullish or bearish. The indicator is very popular among traders and analysts largely because of the ease of interpreting its signals.
With the help of the RSI, you can see the overbought and oversold market, as well as divergence and convergence, indicating a trend reversal.
MFI or Money Flow Index. It shows the intensity with which funds are invested into the asset and withdrawn from it; in fact, it shows the speed of price movement. In its nature, it is similar to the RSI, but differs in the fact that its calculations also consider the volume of trades.
MFI divides financial flows into positive and negative ones. Positive flows cause the price of a financial instrument to rise, respectively, negative flows cause it to fall.
In The Waved Indicator, we use an advanced system for analyzing these indicators in combination with other trigger points. This determines the positions the other players open. And the signal is given when a major player already knocks out all the small players from the market. This is a very important difference: we do not just trade based on indicators, but use them to understand who and where was “robbed” in the market. And when there are signs of a reversal and everything is favorable for us, we take a position.
Signals
The indicator signals appear on the chart as a graphic icon of a certain color and shape. You can set up alerts for them in the form of push notifications in the app or pop-ups on the site. Read this section to learn more about the signals.
WHEN ARE THE SIGNALS GIVEN?
The signals are given at the best moments to enter or exit a position. They are mathematically calculated using the chosen strategy and different types of technical analysis.
Entering a trade using a signal gives you the best conditions for gaining positions. The Master & Premium subscription versions have standard and VSA signals. They can be enabled and disabled, as well as adjusted to the desired timeframes.
-
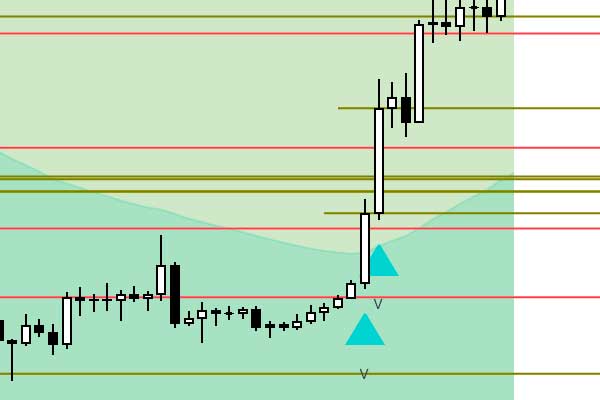
BUY | LONG POSITION ENTRY SIGNAL
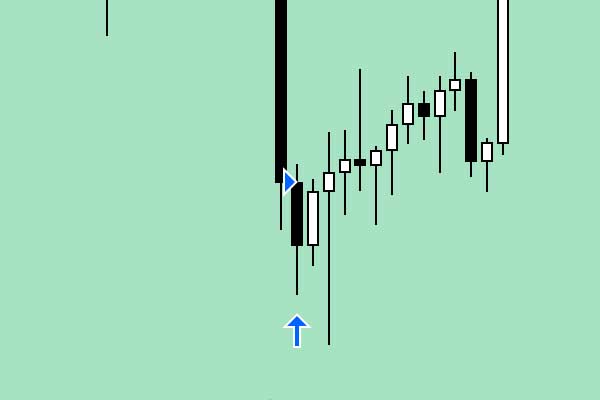
- Action
- Buying an asset at a market price
- View
- Looks like a blue arrow with a triangle pointing up (the triangle shows the entry price)
- Moment
- Given only when the candle opens, when the strategy shows that buying an asset would be profitable
- Details
- -This signal is given at the moment when most standard strategies have closed a loss and there is an opportunity for the asset growth
– Very often this signal is the beginning of a reversal when it is given on large timeframes
– If this signal coincides with the VSA signal, it increases the chances of asset growth
-
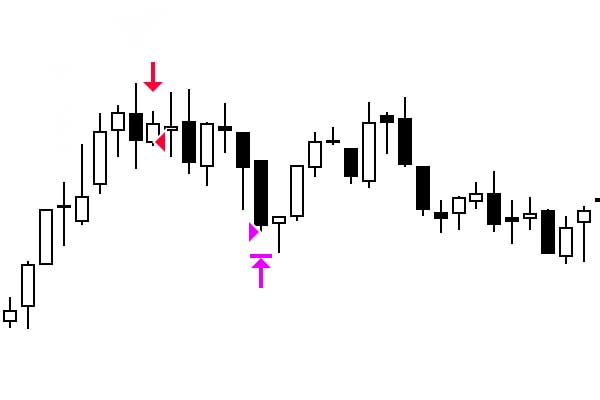
EXIT LONG BY PROFIT | EXITING A LONG POSITION (PROFIT TAKING)
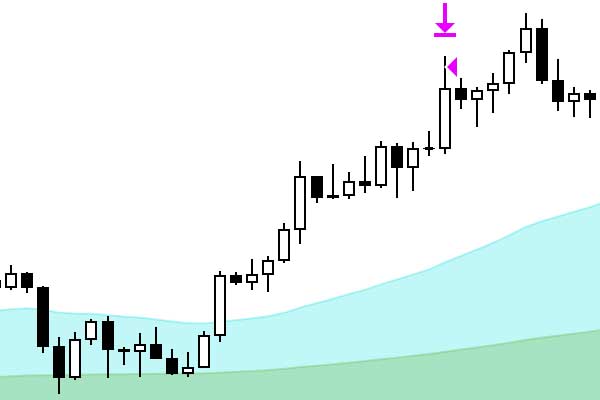
- Action
- Exiting a long position at the market price
- View
- Looks like a purple arrow with a triangle (The triangle shows the exit price)
- Moment
- Given at the moment when the price crosses the set profit limit in the indicator settings (Long Take Profit %)(Long Take Profit %)
- Details
- – This signal is given at the moment when most standard strategies close their profits
– Very often this signal is the beginning of a reversal when it is given on large timeframes
– Often this signal is given on an upward price impulse and you need to manage to take a profit
– Some strategies use this signal to start gaining a short position
– In the PRO version, it is set automatically on each timeframe
-
EXIT LONG BY STOP | EXITING A LONG POSITION (LOSS LIMITATION)
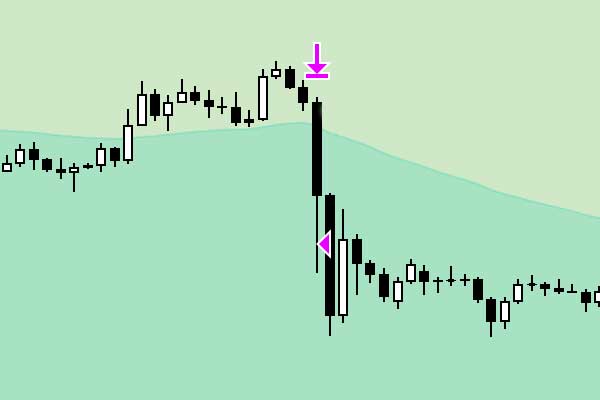
- Action
- Exiting a long position at the market price
- View
- Looks like a purple arrow with a triangle (The triangle shows the exit price)
- Moment
- Given at the moment when the price crosses the set profit limit in the indicator settings (Long Take Profit %)
- Details
- – This signal is given at the moment when most standard strategies close their losses
– Very often this signal is the beginning of a reversal when it is given on large timeframes
– Some strategies use this signal to start gaining a position below the signal mark
– In the PRO version, it is set automatically on each timeframe
-
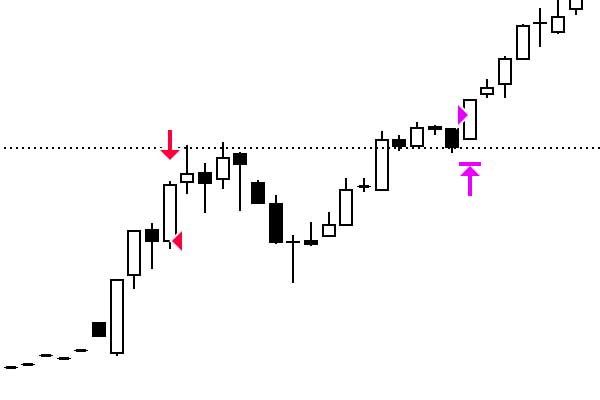
SELL | SHORT POSITION ENTRY SIGNAL
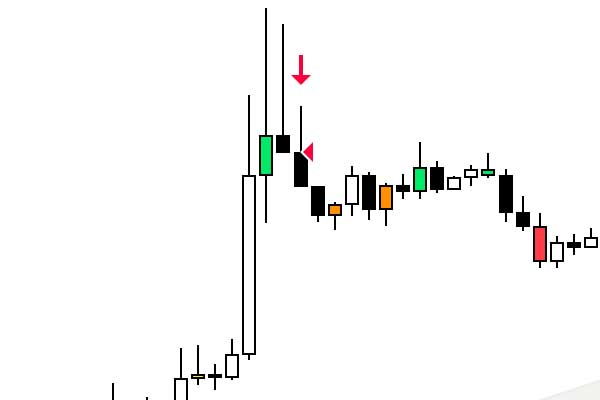
- Action
- Selling an asset at a market price
- View
- Looks like a red arrow with a triangle pointing up (the triangle shows the entry price)
- Moment
- Given only when the candle opens, when the strategy shows that selling an asset would be profitable
- Details
- – This signal is given at the moment when most standard short strategies have closed a loss or taken their profit in long positions, and there is a possibility of a fall in the price of the asset
– Very often this signal is the beginning of a reversal when it is given on large timeframes
– If this signal coincides with the VSA signal, it increases the chances of asset fall
– It is very relevant when it was preceded by a signal to exit a position by profit
-
EXIT SHORT BY PROFIT | EXITIN A SHORT POSITION (PROFIT TAKING)
- Action
- Exiting a short position at the market price
- View
- Looks like a purple arrow with a triangle (The triangle shows the exit price)
- Moment
- Given at the moment when the price crosses the set profit limit in the indicator settings (Short Take Profit %)
- Details
- – This signal is given at the moment when it is recommended to take profit from short position
– Some strategies use this signal to start gaining a long position
– In the PRO version, it is set automatically on each timeframe
-
EXIT SHORT BY STOP | EXIT SHORT POSITION (LOSS LIMITATION)
- Action
- Exiting a short position at the market price
- View
- Looks like a purple arrow with a triangle (The triangle shows the exit price)
- Moment
- Given at the moment when the price crosses the set loss limit in the indicator settings (Short Stop Loss %)
- Details
- – This signal is given at the moment when most standard strategies close their losses
– Very often this signal is the beginning of a reversal when it is given on large timeframes
– Some strategies use this signal to start gaining a position below the signal mark
– In the PRO version, it is set automatically on each timeframe
-
VSA SIGNALS | BUY
- Action
- Entry into the long position at the market price
- View
- Looks like green, pink and purple triangle at the bottom of the candlestick with a drawn buy level
- Moment
- Given when a new bar opens and the VSA pattern i determined
- Details
- – This signal is given at the moment when the market situation indicates gaining a position by a major player
– Very often this signal is the beginning of a reversal when it is given on large timeframes
– In the PRO version, it is not shown on the chart, but a position is automatically entered on timeframes 1D and above
-
VSA SIGNALS | SELL
- Action
- Entering a short position at the market price
- View
- Looks like a red triangle at the top of the candlestick
- Moment
- Given when a new bar opens and the VSA pattern is determined
- Details
- – This signal is given at a time when there is a lot of pressure on the price and there is no strong buyer
– Very often this signal is the beginning of a reversal if it is given 2-4 times on large timeframes
– In the PRO version, it is not shown on the chart and is ignored when entering a short position
-
VOLUMES | VOLUME SIGNALS
- Action
- Confirmation of the price movement direction
- View
- Looks like a blue triangle above or below the candlestick
- Moment
- Given when a new bar opens and indicates high volume in the movement direction
- Details
- – This signal is given at the moment when there is a trading volume exceeding the average size by several times
– Very often this signal is a confirmation of the price movement
– In the PRO version, it is not shown on the chart
Details about all types and subtleties of VSA signals can be found in the user manual, after subscribing to any version of the indicator.
Indicator settings
Information on the settings is described in detail in the user manual, which is available for download after subscribing.
-
SHOW DATE RANGE | STRATEGY START DATE
Available in: PRO MASTER PREMIUM
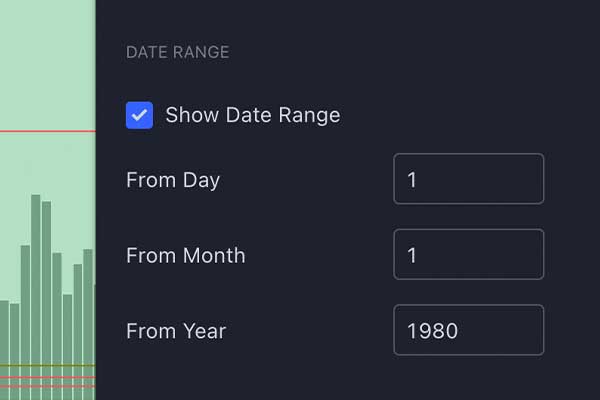
- Checkbox
- Enabling / Disabling the strategy start date
- Description
- – Set the start date of the strategy, if necessary
– If the tick is off, the strategy will work from the beginning of the chart - From Day
- The day of the month from which the strategy will work
- From Month
- The month from which the strategy will work
- From Year
- The year from which the strategy will work
-
TRIPPLE MA | THREE MOVING AVERAGES
Available in: PREMIUM
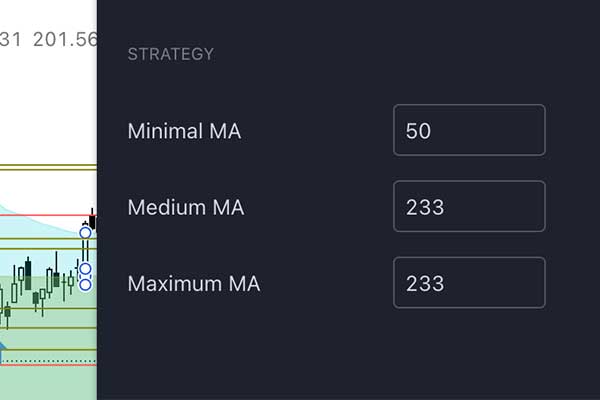
- Minimal, Medium, Maximum MA
- Filter of signals from three moving averages
- Description
- – Signal to a long position will be given in accordance with the strategy conditions and only if the price is below three moving averages
– Signal to a short position will be given in accordance with the strategy conditions and only if the price is above three moving averages
-
MA% | PERCENTAGE DEVIATION FROM THE MOVING AVERAGE 233
Available in: PREMIUM
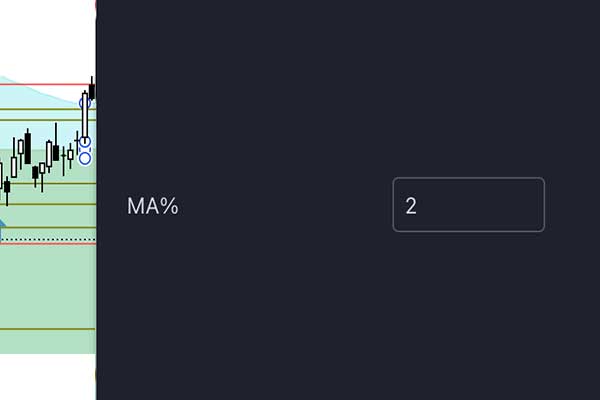
- PERCENTAGE
- Specify the percentage of deviation from the moving average for 233 candlesticks.
- Description
- – Signal to a long position will be given in accordance with the strategy conditions and only if the price is below the specified percentage
– Signal to a short position will be given in accordance with the strategy conditions and only if the price is above the specified percentage
-
TAKE PROFIT % | PERCENTAGE OF THE TAKE PROFIT SIGNAL
Available in: MASTER PREMIUM
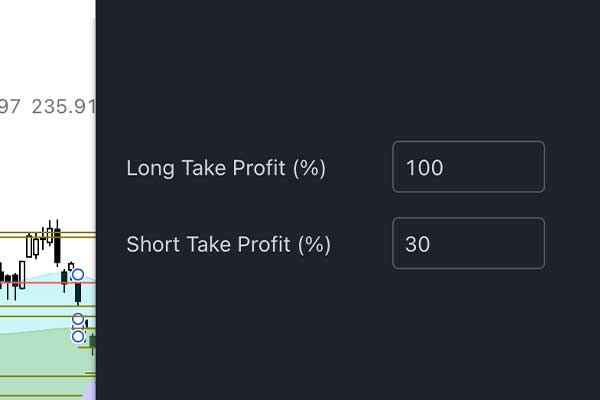
- Long Take Profit%
- Percentage of price deviation from the signal in a long position, upon reaching which the signal will be given – Exit Long by Profit (taking profit from long position)
- Short Take Profit%
- Percentage of price deviation from the signal in a short position, upon reaching which the signal will be given – Exit Short by Profit (taking profit from short position)
-
STOP LOSS % | PERCENTAGE OF STOP LOSS SIGNAL
Available in: MASTER PREMIUM
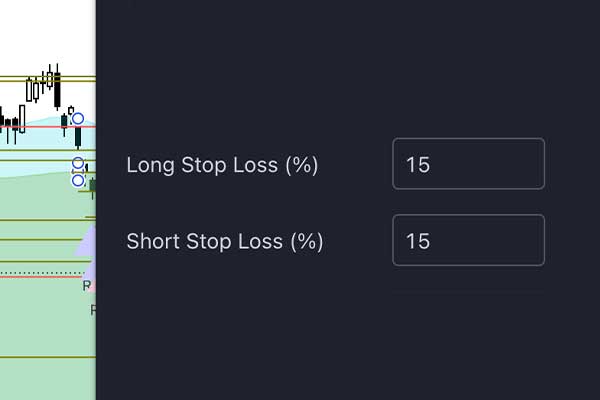
- Long Stop Loss%
- Percentage of price deviation from the signal in a long position, upon reaching which the signal will be given – Exit Long by Stop (maximum loss taking from long position)
- Short Stop Loss%
- Percentage of price deviation from the signal in a short position, upon reaching which the signal will be given – Exit Short by Stop (maximum loss taking from short position)
-
RSI FILTER | OVERBOUGHT AND OVERSOLD RSI INDICATOR
Available in: PREMIUM
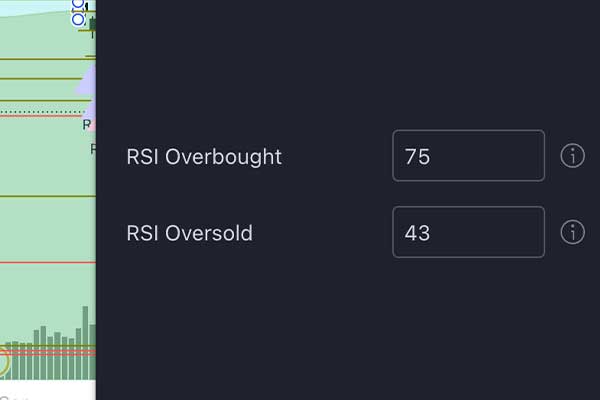
- RSI Overbought
- Short signal will be given in accordance with the strategy conditions and only if the RSI parameter is higher than the specified
- RSI Oversold
- Long signal will be given in accordance with the strategy conditions and only if the RSI parameter is lower than the specified one
- IMPORTANT
- This parameter is indicated by a relative number. This means that it is calculated within the strategy and does not depend on the RSI calculation interval you want to choose.
-
MFI FILTER | OVERBOUGHT AND OVERSOLD MFI INDICATOR
Available in: PREMIUM
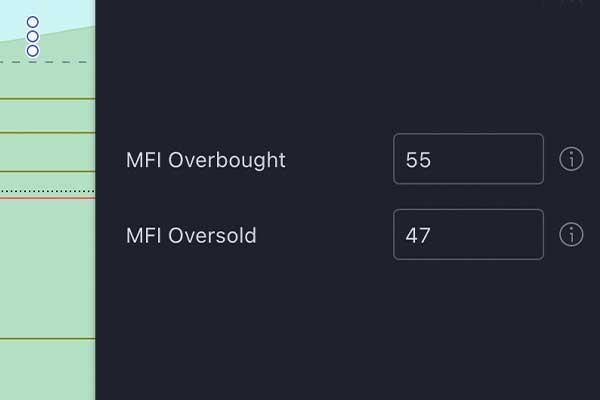
- MFI Overbought
- Short signal will be given in accordance with the strategy conditions and only if the MFI parameter is higher than the specified
- MFI Oversold
- Long signal will be given in accordance with the strategy conditions and only if the MFI parameter is lower than the specified one
- IMPORTANT
- This parameter is indicated by a relative number. This means that it is calculated within the strategy and does not depend on the MFI calculation interval you want to choose.
-
VSA SETTINGS | VSA SIGNAL AND PATTERN SETTINGS
Available in: MASTER PREMIUM
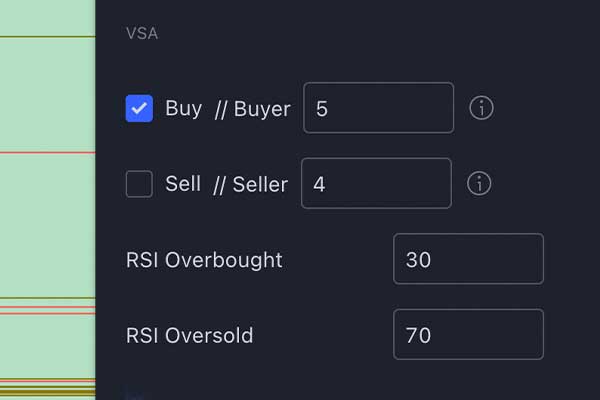
- Buy // Buyer Checkbox
- Enabling / Disabling entering long position by VSA signals. When this tick is enabled, entry signals will be given in addition to the main signals.
- Buy // Buyer Parameters
- 1 – The main VSA patterns of the long position
2 – The main VSA patterns of the long position, only when the asset price falls
3 – The main VSA patterns of the long position, only with an average drop in the asset price
4 – The main VSA patterns of the long position, only with a prolonged drop in the asset price
5 – Basic and additional VSA patterns of the long position
6 – The main and additional VSA patterns of the long position, only when the asset price falls
7 – The main and additional VSA patterns of the long position, only with an average drop in the asset price
8 – The main and additional VSA patterns of the long position, only with a prolonged drop in the asset price
9 – All VSA patterns and Volume signals - Sell // Seller Checkbox
- Enabling / Disabling entering a short position by VSA signals. When this tick is enabled, entry signals will be given in addition to the main signals.
- Sell // Seller Paremeters
- 1 – Basic VSA patterns of short position
2 – The main VSA patterns of the short position, only when the asset price falls
3 – The main VSA patterns of the short position, only with an average drop in the asset price
4 – The main VSA patterns of the short position, only with a prolonged drop in the asset price
5 – All short position patterns and volume signals (Volumes) - VSA / RSI Overbought
- VSA / RSI Oversold
- This parameter blocks VSA signals in the long position if the technical parameter RSI exceeds the specified one
- IMPORTANT
- This parameter is indicated by a relative number. This means that it is calculated within the strategy and does not depend on the RSI calculation interval you want to choose.
-
VOLUME LINE ONOFF | VOLUME LEVEL AND SIGNAL SETTINGS
Available in: PREMIUM
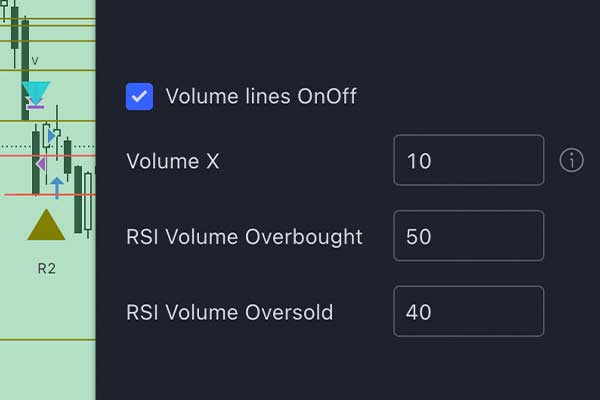
- Volume line OnOff Checkbox
- Enabling/disabling the display of volume level lines on the chart
- Volume X
- Parameter that shows how many times the average volume should be exceeded for the volume entry signal to be displayed
- Volumes / RSI Overbought
- This parameter blocks Volumes signals in the short position if the technical parameter RSI is below the specified one
- Volumes / RSI Oversold
- This parameter blocks Volumes signals to the long position, if the technical parameter RSI exceeds the specified value
- IMPORTANT
- This parameter is indicated by a relative number. This means that it is calculated within the strategy and does not depend on the RSI calculation interval you want to choose.
Volume analysis
Volume shows the number of closed contracts per unit of time. The volume of trading alone does not affect the asset’s price, but the dynamics of volume change does. If trading volumes do not change for a long time, then the price remains in one place. The movement begins when large volumes are brought to the asset.
And the volume analysis helps follow them. To determine positions, it is very important to understand the directions of volume movement.
In the Premium version of the indicator, you can configure volume analysis signals and filter by the percentage of increase in trading volumes. These signals show the main vector of price changes in the near future.
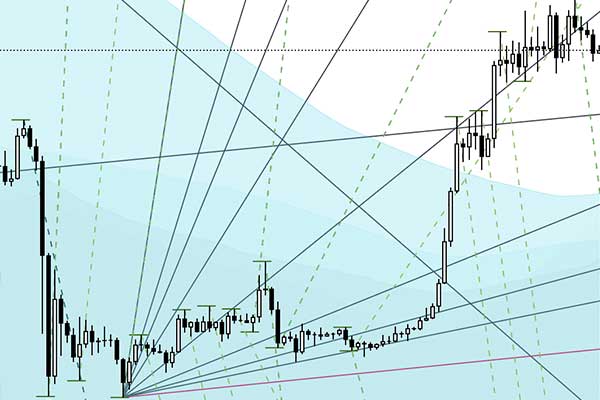
Automatic levels
In trading, there are concepts of support and resistance levels. A resistance level is formed when buyers refuse to buy an asset, thereby no longer supporting the upward price momentum. The support level, on the contrary, is formed when sellers refuse to trade an asset below a certain price. In this case, the price movement momentum is weakened. In this case, we can observe either consolidation in the market or rebound of a price in the opposite direction. There are three types of support and resistance levels: historical, psychological, and mathematical.
- Historical levels are the strongest and most relevant ones, as they are formed based on real market situations when a certain price threshold is not crossed for a long period of time.
- Psychological levels, as the name implies, are based on the psychology of traders. Their essence lies in the fact that people like round numbers, so they put Stop Losses and take profits on “convenient” values. Basically, these levels do not have the same strength as historical ones. But they can be strengthened by coincidence.
- Mathematical or calculated ones are used to predict further price movement and are calculated using various mathematical algorithms.
Many traders find support and resistance levels by eye. But this method does not give an accurate picture of what is happening in the market. In our indicator, they are formed in places calculated by the VSA method. They are drawn on the chart automatically and help the trader to better understand the market situation.
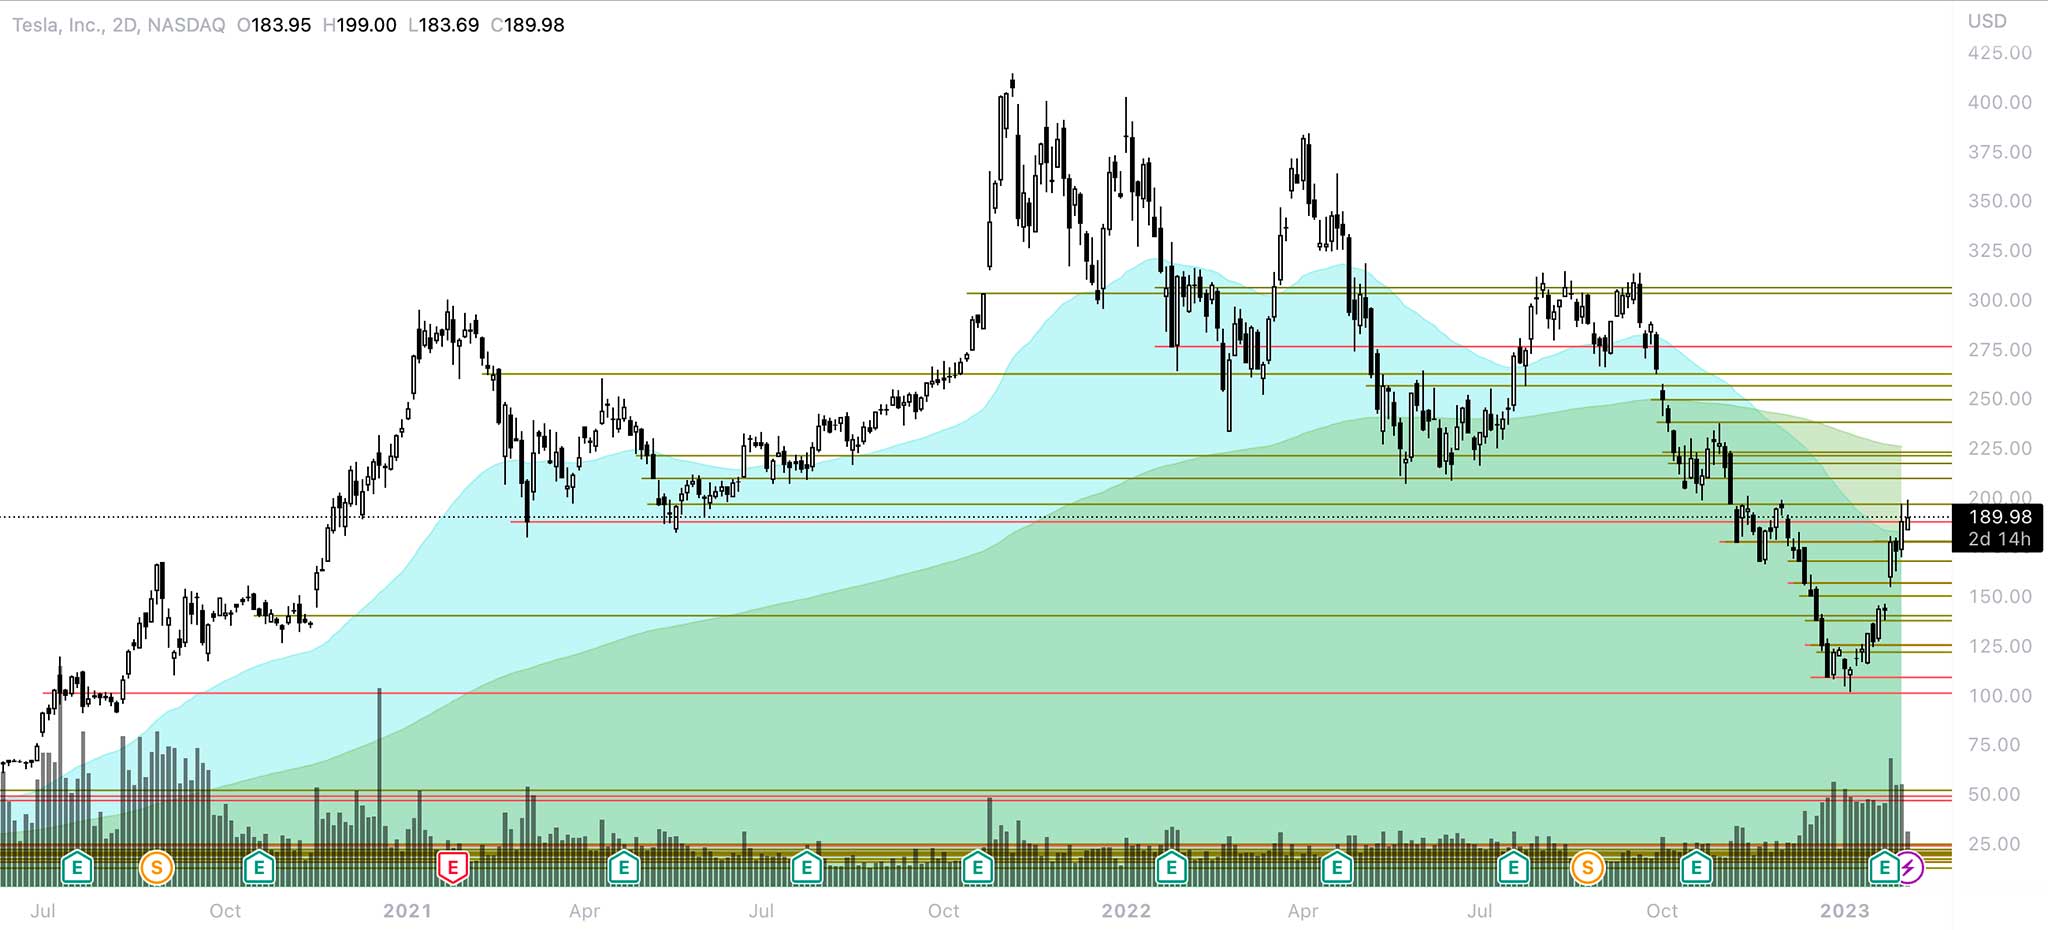
They look like green and red horizontal lines on the chart. Examples show how they work. And the coolest thing is that they work even on the smallest timeframes. Thereby letting you take a perfect position. These levels are available only in the Master and Premium subscription versions.
TheWaved™ Helper indicator
This indicator is available for Premium version users only and is not sold by subscription. This is a unique indicator that not only gives you signals for action, but also provides insight into what they are based on and enables you to make highly accurate predictions. It helps the trader in determining the trade entry and exit points and analyzing the market situation. It has all the necessary functions and is an excellent addition for professional market analytics!
-
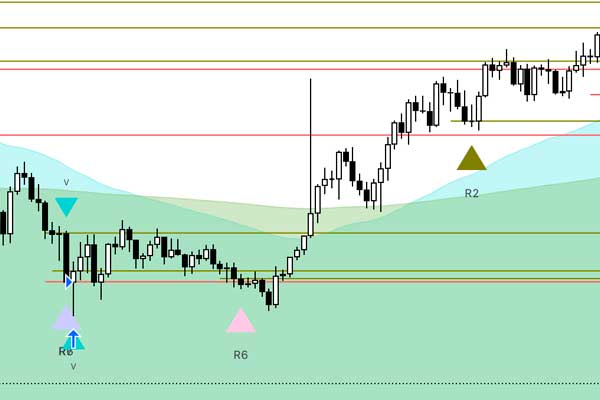
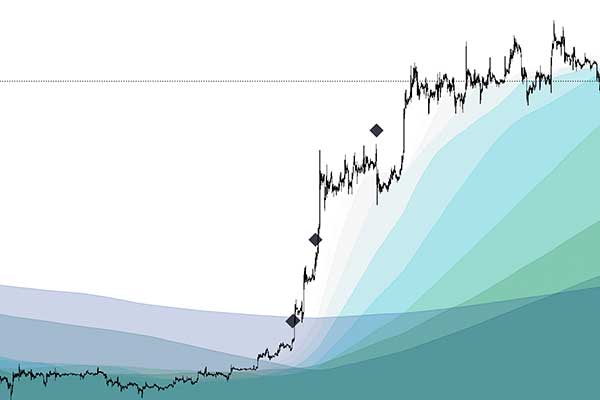
DIVERGENCE SIGNALS
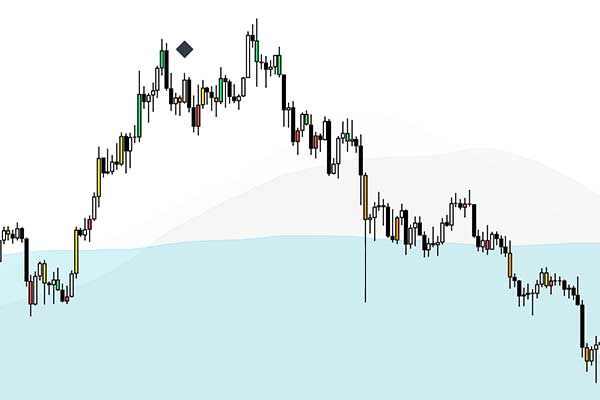
- Action
- Waiting for a market reversal from the current level
- View
- Looks like a black diamond above or below the candlestick
- Moment
- Given only when a candlestick opens and divergence of the indicator and price is noticed in the market
- Details
- – This signal is given when the price is at a peak and dynamics shows the divergence of the RSI indicator and the asset price
– This is often used in strategies that work only on the analysis of indicators according to RSI data
– When the peak value of the RSI is reached, many players enter counter-trend trades and place stops above the local Highы
– Often, the price after such a signal breaks High, removing stops of players and the market reversal occurs
– If the signal is given from the bottom of the candle, then upward reversal of the asset price is expected
– If the signal is given from the top of the candle, then downward reversal of the asset price is expected
-
ASSET ANALYSIS ASSISTANT
- Action
- Shows the possible support and resistance levels of the price
- View
- Looks like dotted lines coming from the local Low or High
- Moment
- Given when the candlestick opens, according to the formula and the bar opening of which was higher than the Low of the previous bar
- Details
- – Created for correct building of Gann rays
– Allows to accurately determine the position’s opening points
– Allows to accurately determine the position’s closing points
– Allows to accurately determine the price reversal points
– Works on all timeframes
-
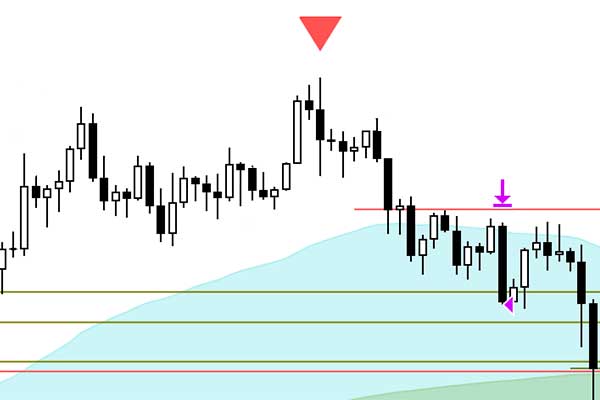
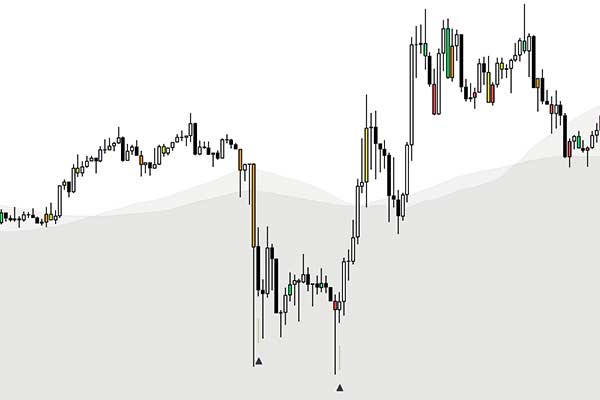
MARKET MANIPULATION PATTERNS
- Action
- Shows possible points of a local price reversal
- View
- Looks like black and empty triangles with a gray line at the bottom or top of the bar
- Moment
- Given when the candle closes and the pattern is determined
- Details
- – Allows to quickly make a decision regardless of the strategy for entering a position
– If the signal is given from the bottom of the candle, then upward reversal of the asset price is expected
– If the signal is given from the top of the candle, then downward reversal of the asset price is expected
– Often works when given repeatedly in the same price range
-
9 FIBONACCI MOVING AVERAGES
- Action
- Shows the average prices for different periods of time
- View
- Looks like waves of different colors
- Moment
- Calculated in real time from all timeframes
- Details
- – Allows making a decision about the current price of the asset
– Often act as price reversal level
– Many strategies are based on moving averages
– Show support and resistance levels
– Can be adjusted for any interval at your discretion
– Dynamic trend lines
-
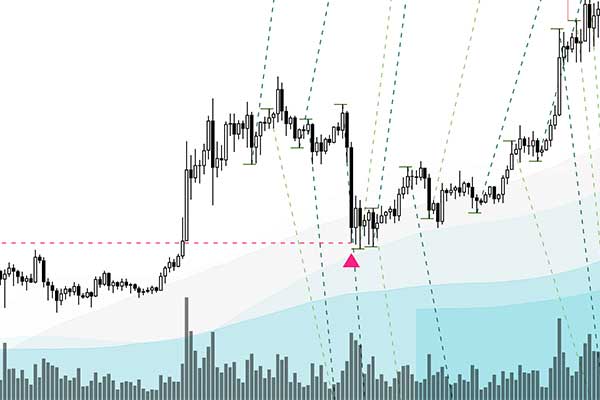
ADDITIONAL PATTERNS OF MARKET SITUATIONS
- Action
- Show withdrawal of stops for different periods of time
- View
- Look like red and orange triangles with a dotted level line
- Moment
- Given when the bar closes, if the asset is bought after removal of stops
- Details
- – Allow determining additional entry points
– Allow getting a better price compared to other players
– Allow to determine the local price reversal
-
DETERMINING LOCAL HIGH AND LOW
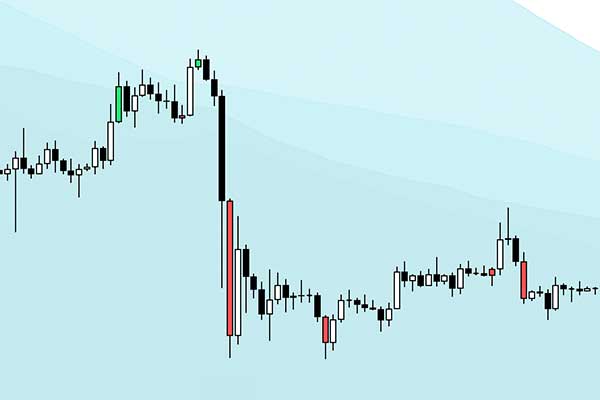
- Action
- Show bars that are absolute High & low
- View
- Look like red and green colored bars
- Moment
- Given when the sequence of bars closes correctly
- Details
- These are local price reversals
– Are often key points in price reversals
– Using these bars, you can correctly draw the trend lines
– Give an accurate understanding of absolute highs
-
PRELIMINARY DETERMINATION OF LOCAL HIGH AND LOW
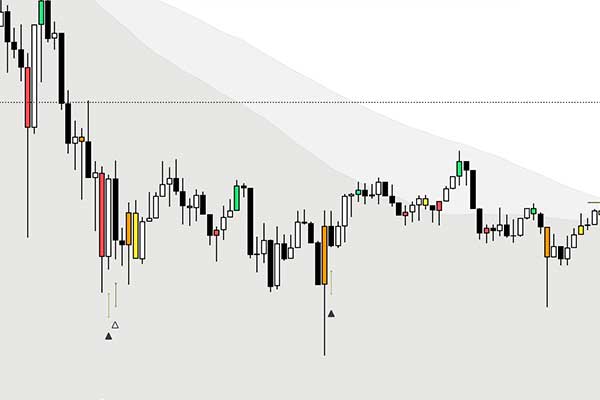
- Action
- Show bars that may be absolute High & low
- View
- Looks like yellow and orange colored bars
- Moment
- Given when the sequence of bars closes correctly
- Details
- – These are preliminary signals for determining Low and High
– Often, these are reversal bars
– Often, these are manipulative bars
Frequently Asked Questions
In this section, you can find the answers to questions all newcomers get at the first purchase.
Connect Quantum Trading Platform with Bybit
To connect to the quantum trading platform The Waved™, you need to follow a few steps.
- Register an account using the partner link and enter the partner code
- Create an API Key for managing trading operations on The Waved™ platform
Register an account using the partner link and enter the partner code
Registering an account through the partner link is necessary for several important reasons.
-
Security
We work with a personal Bybit manager and can always resolve issues related to accounts in our partnership program. This may involve deposits, withdrawals, fees, or access.
-
Control and Transparency
We monitor account activity and address issues that arise in the process, providing full transparency in our work.
-
Fee Rebates
With high trading volumes, we can return a portion of the fees set by the exchange.
Account Registration
- Partner code: 98999
- Follow the link, and when registering, enter our partner code.
- Link: https://partner.bybit.com/b/thewaved
Create an API Key
To create an API Key on the Bybit crypto exchange, you need to follow a few steps.
Go to the link: https://www.bybit.com/app/user/api-management

Select Key Type
Select: System-generated API Keys

Set Permissions
- Select: API Transaction
- Add: Key Name (Can be anything)
- Select: Read & Write
- Select: Only IPs with permissions granted are allowed to access the OpenAPI
- Add the Platform IP Address provided to you
- Add permissions for transactions on Unified Trading Account

Confirm Key Creation
Confirm key creation via Email and phone

Copy the Parameters
- Copy the parameters and send the keys to the manager
- Copy the two parameters API Key and API Secret and provide them to the manager.
- Copy your UID: account number from right account menu

Important
Never send API keys to anyone other than our manager.