In trading, there are concepts of support and resistance levels. A resistance level is formed when buyers refuse to buy an asset, thereby no longer supporting the upward price momentum. The support level, on the contrary, is formed when sellers refuse to trade an asset below a certain price. In this case, the price movement momentum is weakened. In this case, we can observe either consolidation in the market or rebound of a price in the opposite direction. There are three types of support and resistance levels: historical, psychological, and mathematical.
- Historical levels are the strongest and most relevant ones, as they are formed based on real market situations when a certain price threshold is not crossed for a long period of time.
- Psychological levels, as the name implies, are based on the psychology of traders. Their essence lies in the fact that people like round numbers, so they put Stop Losses and take profits on “convenient” values. Basically, these levels do not have the same strength as historical ones. But they can be strengthened by coincidence.
- Mathematical or calculated ones are used to predict further price movement and are calculated using various mathematical algorithms.
Many traders find support and resistance levels by eye. But this method does not give an accurate picture of what is happening in the market. In our indicator, they are formed in places calculated by the VSA method. They are drawn on the chart automatically and help the trader to better understand the market situation.
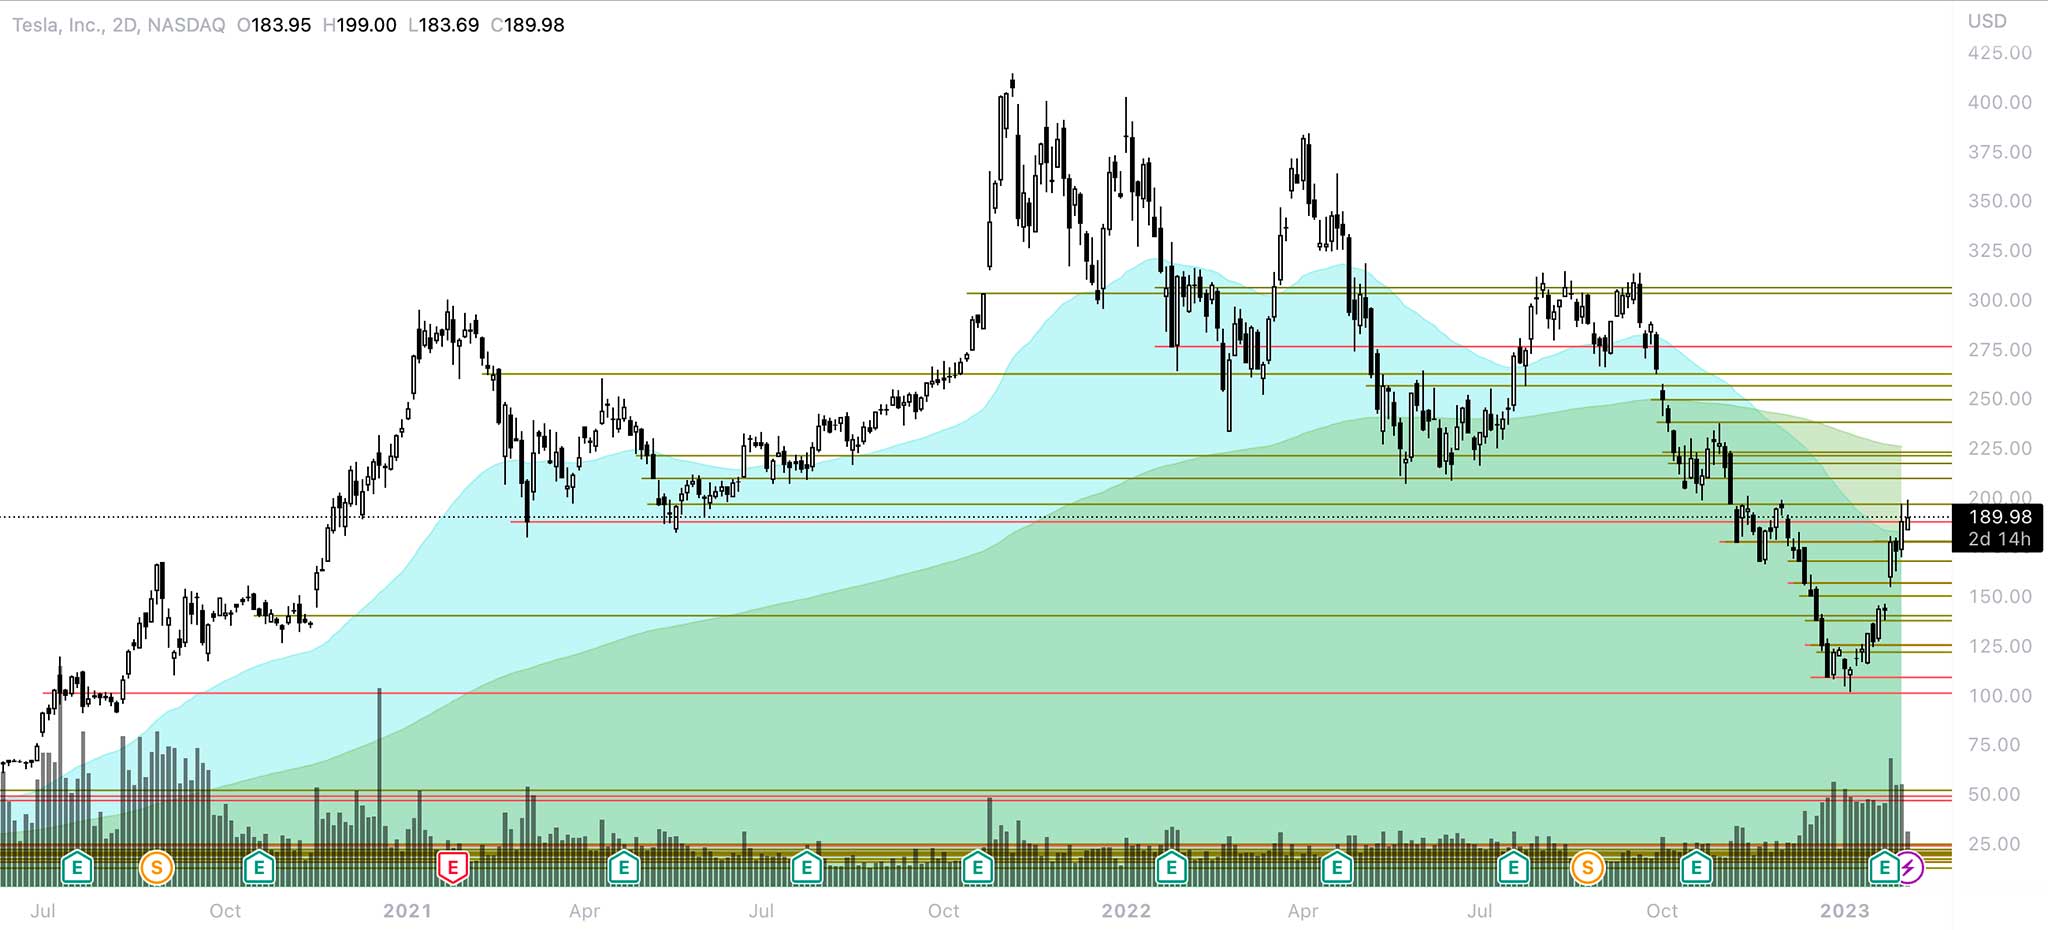
They look like green and red horizontal lines on the chart. Examples show how they work. And the coolest thing is that they work even on the smallest timeframes. Thereby letting you take a perfect position. These levels are available only in the Master and Premium subscription versions.
Posted in: Features