The indicator signals appear on the chart as a graphic icon of a certain color and shape. You can set up alerts for them in the form of push notifications in the app or pop-ups on the site. Read this section to learn more about the signals.
WHEN ARE THE SIGNALS GIVEN?
The signals are given at the best moments to enter or exit a position. They are mathematically calculated using the chosen strategy and different types of technical analysis.
Entering a trade using a signal gives you the best conditions for gaining positions. The Master & Premium subscription versions have standard and VSA signals. They can be enabled and disabled, as well as adjusted to the desired timeframes.
-
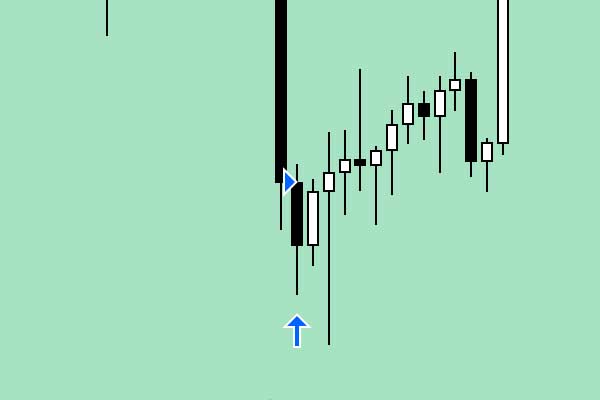
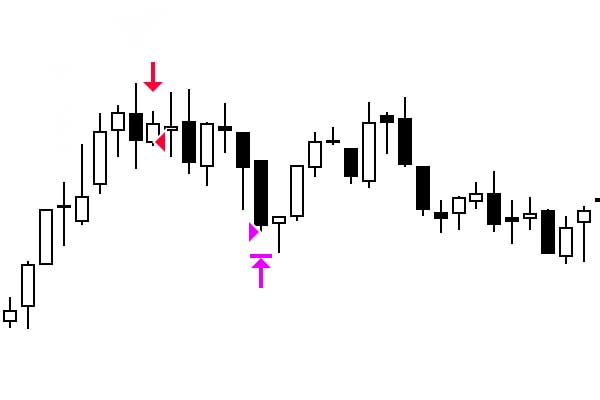
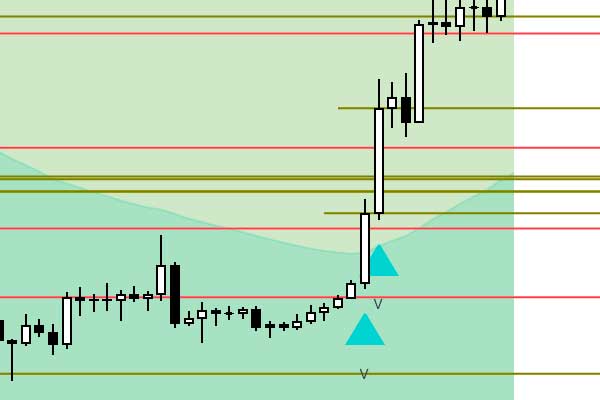
BUY | LONG POSITION ENTRY SIGNAL
- Action
- Buying an asset at a market price
- View
- Looks like a blue arrow with a triangle pointing up (the triangle shows the entry price)
- Moment
- Given only when the candle opens, when the strategy shows that buying an asset would be profitable
- Details
- -This signal is given at the moment when most standard strategies have closed a loss and there is an opportunity for the asset growth
– Very often this signal is the beginning of a reversal when it is given on large timeframes
– If this signal coincides with the VSA signal, it increases the chances of asset growth
-
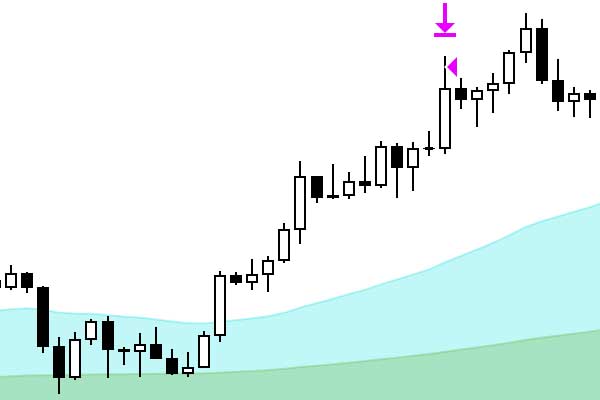
EXIT LONG BY PROFIT | EXITING A LONG POSITION (PROFIT TAKING)
- Action
- Exiting a long position at the market price
- View
- Looks like a purple arrow with a triangle (The triangle shows the exit price)
- Moment
- Given at the moment when the price crosses the set profit limit in the indicator settings (Long Take Profit %)(Long Take Profit %)
- Details
- – This signal is given at the moment when most standard strategies close their profits
– Very often this signal is the beginning of a reversal when it is given on large timeframes
– Often this signal is given on an upward price impulse and you need to manage to take a profit
– Some strategies use this signal to start gaining a short position
– In the PRO version, it is set automatically on each timeframe
-
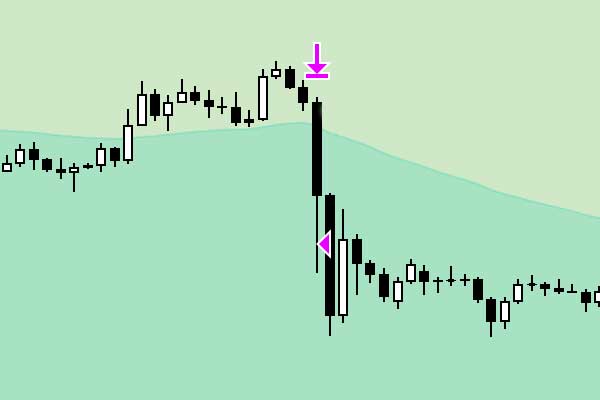
EXIT LONG BY STOP | EXITING A LONG POSITION (LOSS LIMITATION)
- Action
- Exiting a long position at the market price
- View
- Looks like a purple arrow with a triangle (The triangle shows the exit price)
- Moment
- Given at the moment when the price crosses the set profit limit in the indicator settings (Long Take Profit %)
- Details
- – This signal is given at the moment when most standard strategies close their losses
– Very often this signal is the beginning of a reversal when it is given on large timeframes
– Some strategies use this signal to start gaining a position below the signal mark
– In the PRO version, it is set automatically on each timeframe
-
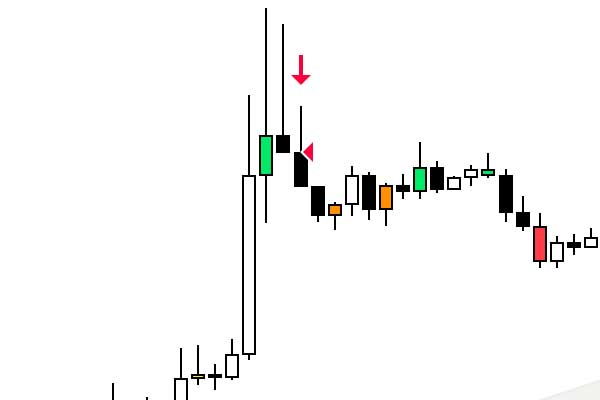
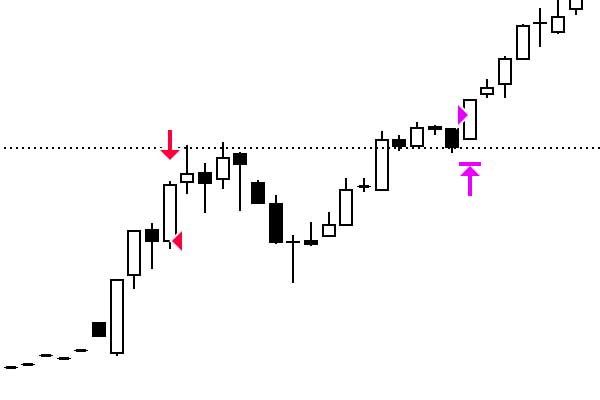
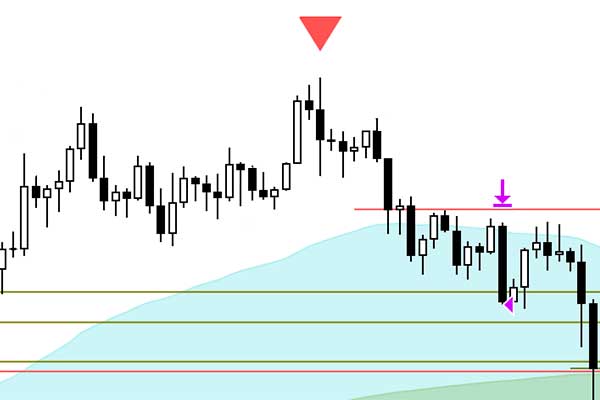
SELL | SHORT POSITION ENTRY SIGNAL
- Action
- Selling an asset at a market price
- View
- Looks like a red arrow with a triangle pointing up (the triangle shows the entry price)
- Moment
- Given only when the candle opens, when the strategy shows that selling an asset would be profitable
- Details
- – This signal is given at the moment when most standard short strategies have closed a loss or taken their profit in long positions, and there is a possibility of a fall in the price of the asset
– Very often this signal is the beginning of a reversal when it is given on large timeframes
– If this signal coincides with the VSA signal, it increases the chances of asset fall
– It is very relevant when it was preceded by a signal to exit a position by profit
-
EXIT SHORT BY PROFIT | EXITIN A SHORT POSITION (PROFIT TAKING)
- Action
- Exiting a short position at the market price
- View
- Looks like a purple arrow with a triangle (The triangle shows the exit price)
- Moment
- Given at the moment when the price crosses the set profit limit in the indicator settings (Short Take Profit %)
- Details
- – This signal is given at the moment when it is recommended to take profit from short position
– Some strategies use this signal to start gaining a long position
– In the PRO version, it is set automatically on each timeframe
-
EXIT SHORT BY STOP | EXIT SHORT POSITION (LOSS LIMITATION)
- Action
- Exiting a short position at the market price
- View
- Looks like a purple arrow with a triangle (The triangle shows the exit price)
- Moment
- Given at the moment when the price crosses the set loss limit in the indicator settings (Short Stop Loss %)
- Details
- – This signal is given at the moment when most standard strategies close their losses
– Very often this signal is the beginning of a reversal when it is given on large timeframes
– Some strategies use this signal to start gaining a position below the signal mark
– In the PRO version, it is set automatically on each timeframe
-
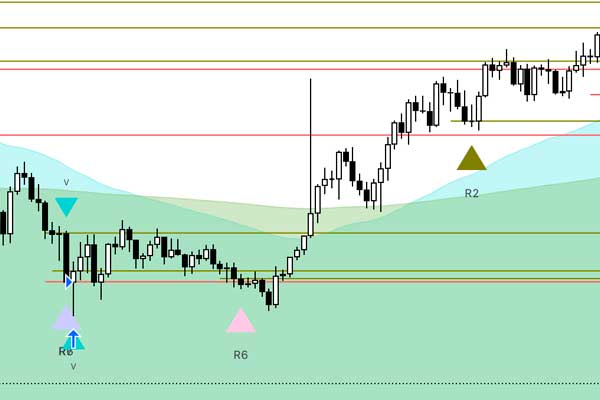
VSA SIGNALS | BUY
- Action
- Entry into the long position at the market price
- View
- Looks like green, pink and purple triangle at the bottom of the candlestick with a drawn buy level
- Moment
- Given when a new bar opens and the VSA pattern i determined
- Details
- – This signal is given at the moment when the market situation indicates gaining a position by a major player
– Very often this signal is the beginning of a reversal when it is given on large timeframes
– In the PRO version, it is not shown on the chart, but a position is automatically entered on timeframes 1D and above
-
VSA SIGNALS | SELL
- Action
- Entering a short position at the market price
- View
- Looks like a red triangle at the top of the candlestick
- Moment
- Given when a new bar opens and the VSA pattern is determined
- Details
- – This signal is given at a time when there is a lot of pressure on the price and there is no strong buyer
– Very often this signal is the beginning of a reversal if it is given 2-4 times on large timeframes
– In the PRO version, it is not shown on the chart and is ignored when entering a short position
-
VOLUMES | VOLUME SIGNALS
- Action
- Confirmation of the price movement direction
- View
- Looks like a blue triangle above or below the candlestick
- Moment
- Given when a new bar opens and indicates high volume in the movement direction
- Details
- – This signal is given at the moment when there is a trading volume exceeding the average size by several times
– Very often this signal is a confirmation of the price movement
– In the PRO version, it is not shown on the chart
Details about all types and subtleties of VSA signals can be found in the user manual, after subscribing to any version of the indicator.
Posted in: Features