This indicator is available for Premium version users only and is not sold by subscription. This is a unique indicator that not only gives you signals for action, but also provides insight into what they are based on and enables you to make highly accurate predictions. It helps the trader in determining the trade entry and exit points and analyzing the market situation. It has all the necessary functions and is an excellent addition for professional market analytics!
-
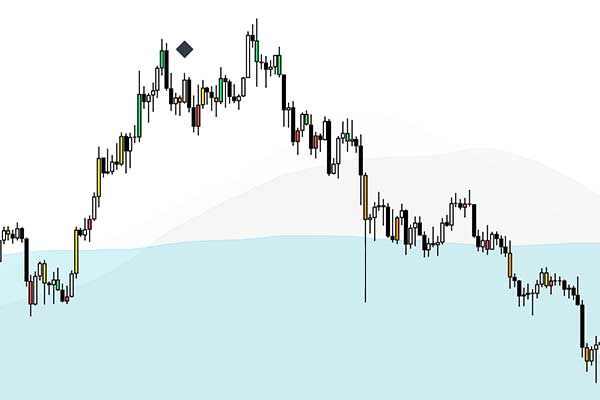
DIVERGENCE SIGNALS
- Action
- Waiting for a market reversal from the current level
- View
- Looks like a black diamond above or below the candlestick
- Moment
- Given only when a candlestick opens and divergence of the indicator and price is noticed in the market
- Details
- – This signal is given when the price is at a peak and dynamics shows the divergence of the RSI indicator and the asset price
– This is often used in strategies that work only on the analysis of indicators according to RSI data
– When the peak value of the RSI is reached, many players enter counter-trend trades and place stops above the local Highы
– Often, the price after such a signal breaks High, removing stops of players and the market reversal occurs
– If the signal is given from the bottom of the candle, then upward reversal of the asset price is expected
– If the signal is given from the top of the candle, then downward reversal of the asset price is expected
-
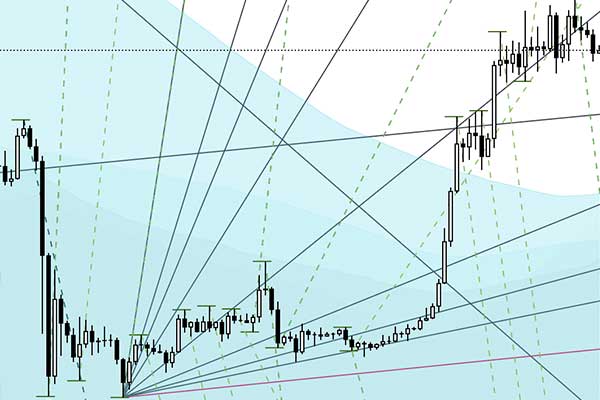
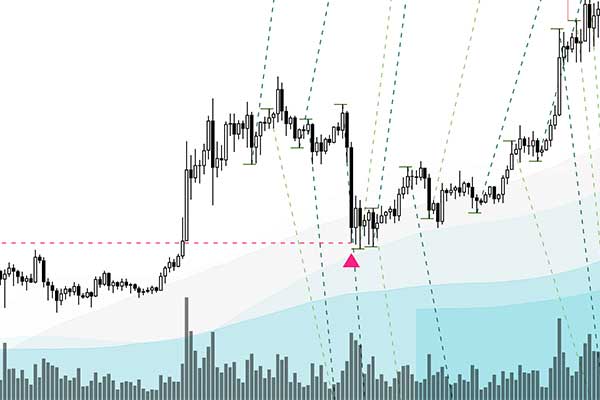
ASSET ANALYSIS ASSISTANT
- Action
- Shows the possible support and resistance levels of the price
- View
- Looks like dotted lines coming from the local Low or High
- Moment
- Given when the candlestick opens, according to the formula and the bar opening of which was higher than the Low of the previous bar
- Details
- – Created for correct building of Gann rays
– Allows to accurately determine the position’s opening points
– Allows to accurately determine the position’s closing points
– Allows to accurately determine the price reversal points
– Works on all timeframes
-
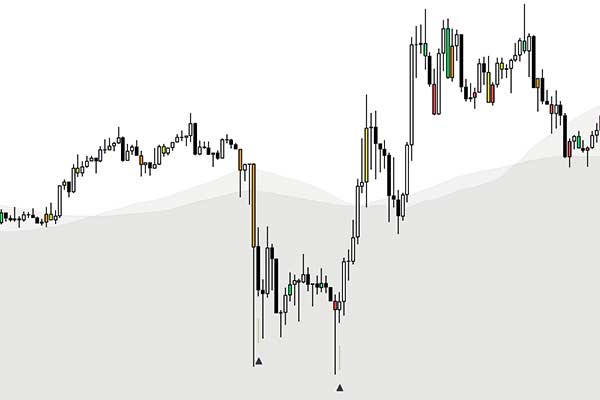
MARKET MANIPULATION PATTERNS
- Action
- Shows possible points of a local price reversal
- View
- Looks like black and empty triangles with a gray line at the bottom or top of the bar
- Moment
- Given when the candle closes and the pattern is determined
- Details
- – Allows to quickly make a decision regardless of the strategy for entering a position
– If the signal is given from the bottom of the candle, then upward reversal of the asset price is expected
– If the signal is given from the top of the candle, then downward reversal of the asset price is expected
– Often works when given repeatedly in the same price range
-
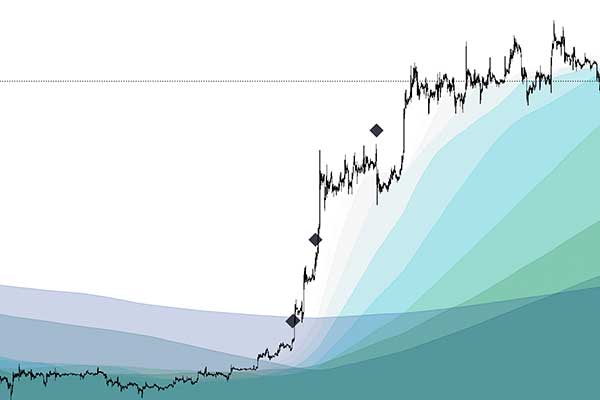
9 FIBONACCI MOVING AVERAGES
- Action
- Shows the average prices for different periods of time
- View
- Looks like waves of different colors
- Moment
- Calculated in real time from all timeframes
- Details
- – Allows making a decision about the current price of the asset
– Often act as price reversal level
– Many strategies are based on moving averages
– Show support and resistance levels
– Can be adjusted for any interval at your discretion
– Dynamic trend lines
-
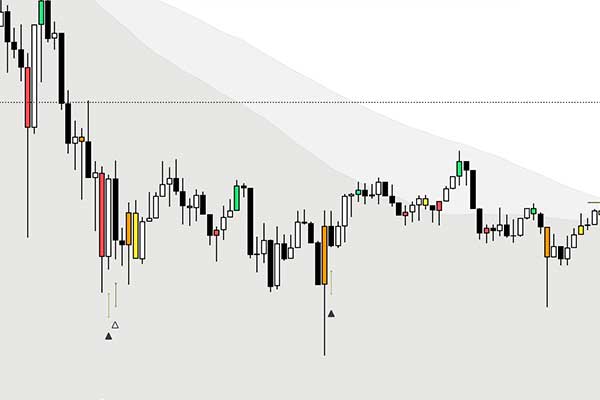
ADDITIONAL PATTERNS OF MARKET SITUATIONS
- Action
- Show withdrawal of stops for different periods of time
- View
- Look like red and orange triangles with a dotted level line
- Moment
- Given when the bar closes, if the asset is bought after removal of stops
- Details
- – Allow determining additional entry points
– Allow getting a better price compared to other players
– Allow to determine the local price reversal
-
DETERMINING LOCAL HIGH AND LOW
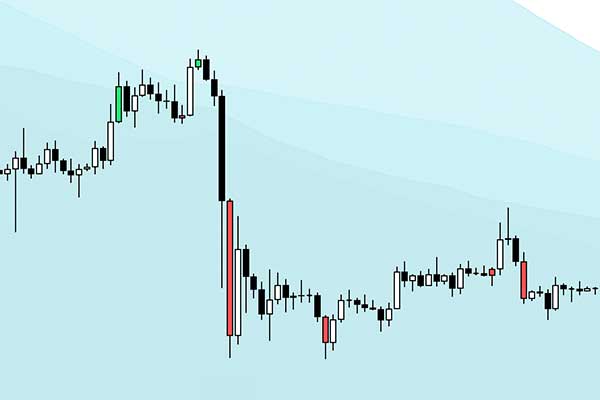
- Action
- Show bars that are absolute High & low
- View
- Look like red and green colored bars
- Moment
- Given when the sequence of bars closes correctly
- Details
- These are local price reversals
– Are often key points in price reversals
– Using these bars, you can correctly draw the trend lines
– Give an accurate understanding of absolute highs
-
PRELIMINARY DETERMINATION OF LOCAL HIGH AND LOW
- Action
- Show bars that may be absolute High & low
- View
- Looks like yellow and orange colored bars
- Moment
- Given when the sequence of bars closes correctly
- Details
- – These are preliminary signals for determining Low and High
– Often, these are reversal bars
– Often, these are manipulative bars
Posted in: Features